California’s Orange County Infrastructure Isn’t Improving
July 21st, 2016 | By: America's Infrastructure Report Card
The Orange County Branch of the American Society of Civil Engineers today released its 2016 Orange County Infrastructure Report Card, grading 12 categories of the county’s infrastructure, resulting in an overall grade point average of “C+.” The Report Card was developed in collaboration with the UC Irvine Civil and Environmental Engineering Affiliates, an advisory group to the UCI Samueli School’s Civil and Environmental Engineering Department. A team of professional engineers from Orange County assessed the 12 categories, including Aviation (A-), Electric Power (C-), Flood Control & Levees (C-), Ground Transportation (C), Natural Gas (B-), Oil (B-), Parks, Recreation & Environment (C+), School Facilities (C), Solid Waste (B), Surface Water Quality (D+), Wastewater (B), and Water Supply (B). This is the fourth Orange County Infrastructure Report Card. The first, released in 2002, gave the county’s infrastructure a GPA of “C;” in subsequent releases in 2005 and 2010, the GPA has stayed constant at a “C+.” “In this first assessment of Orange County’s infrastructure since the 2008 recession, we found that while some areas have improved incrementally, others have declined, leaving our overall GPA stalled for more than a decade,” said Yaz Emrani, P.E., OC Infrastructure Report Card Chair. “Since our infrastructure works as a system, it’s important that Orange County increase investment so that we can move our infrastructure from ‘catching up’ to ‘ready for the future.’” The 2016 Orange County Infrastructure Report Card finds that much of the county’s infrastructure needs additional investment to keep up with demand. Of note:- While commercial traffic at John Wayne Airport approaches the current negotiated passenger limit of 10.8 million annual passengers until 2020, both general aviation and military demand fall short of meeting Orange County’s available capacity.
- Funding shortfalls for needed upgrades to bring regional flood control facilities in the county to its standards continue to be in excess of $2.7 billion.
- Deferred maintenance during the recent recession has exacerbated ground transportation needs. The existing funding sources are inadequate to meet the current and future demand, and it is estimated Orange County needs an additional $133 million annually.
- The condition of school facilities has declined in the past five years due to lack of funding.
- Due to increased volume of stormwater runoff during storm events, existing surface water quality infrastructure in Orange County does not have nearly the capacity to meet wet weather demands.
- Performing continuous and timely maintenance on the infrastructure to prolong use and minimize the need for costly repairs.
- Conducting comprehensive planning and long-term investment to ensure sound decisions about infrastructure.
- Preserving the environment while fostering economic growth and personal mobility.
Florida’s Infrastructure Needs to Keep up with Growth
July 14th, 2016 | By: America's Infrastructure Report Card
 Impact of Florida’s Infrastructure
Infrastructure is the backbone of Florida’s economy and a necessary part of every Floridian’s day. The Florida Section of the American Society of Civil Engineers released the 2016 Report Card for Florida’s Infrastructure on Thursday, July 14. The report includes an evaluation of the state’s aviation, bridges, coastal areas, drinking water, energy, ports, roads, schools, stormwater, transit, and wastewater (see grades below).
Keeping Up With Growth
One of the key findings from this report is that Florida is growing, and the State’s infrastructure needs a growth spurt of its own to keep up. Recently Florida’s population has grown at a rate of about 1% per year, adding about 1 million people, which is the equivalent of adding a city the size of Jacksonville every 5 years. Some cities and counties are stepping up their efforts, but more needs to be done across the state by every infrastructure owner. The good news is that investments in areas like bridges and smart technology investment solutions seen in ports and airports are raising Florida’s grades. As Florida grows, investing in infrastructure must be Florida’s top priority to continue to be the place people want to live and work as well as attract visitors from around the country and the world.Virginia's Infrastructure Struggle for Status Quo
January 23rd, 2015 | By: Infrastructure Report Card
With a state that’s growing as fast as Virginia, you’re bound to have growing pains, but none are as striking or obvious as the traffic gridlock across the state. So, would you be surprised that the Virginia Section of the American Society of Civil Engineers gave roads a D grade in their new 2015 Report Card for Virginia’s Infrastructure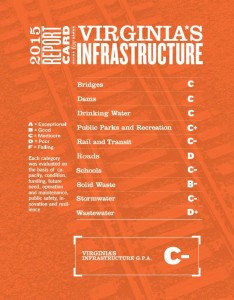 ? While some big steps were taken by the legislature in 2013 to bring renewed funding to transportation, may end up only keeping the status quo of transportation troubles across the state whether by car or transit. Another growing pain issue for Virginia is there are a lot of dams in the state (1,789 to be exact) and the number of people that now live behind old dams has increased with the growth of the state. The majority of dams were constructed between 1950 and 1975, making the average age more than 50 years old. With an increasing population, more houses and businesses are now below dams which means there’s more risk for damage and lives being lost if there was a failure. The good news is that Virginia has made a lot of progress in identifying and educating owners on how to fix dams that are considered high-hazard, but the bad news is that 141 of these high-hazard dams do not meet current dam safety standards, resulting in a grade of C for Virginia’s dams. Growth is also affecting schools as localities try to keep up with growing schools in some areas and older school maintenance in localities that seem to be losing students and residents.
Not only is Virginia growing, but its infrastructure is also starting to show its age with basic services like water, wastewater, and stormwater representing the old infrastructure bones of the cities. Virginia’s 2,830 public water systems providing drinking water to more than 7 million Virginians, and the Report Card found that many of these systems are 70 years or older and require significant asset renewal in the immediate future. The bad news is that funding is slim – from 2000 to 2012, the state only saw $200 million in Drinking Water State Revolving Funds, which is less than 10% of the commonwealth’s total investment needs. Wastewater needs have jumped 45%, and best estimates show $1 billion is needed to control overflows that pollute local waters. Also, stormwater systems are equally old, and surveys show about one-third of the infrastructure is older than 50 years and much of the remainder was built 25 to 50 years ago. While every bit of funding helps, the reality is Virginia’s water systems are only getting older each day and each dollar available is being split between trying to fix yesterday’s problems and today’s.
Growth and age are like a one-two punch to Virginia’s infrastructure causing a real struggle to maintain an acceptable level of infrastructure service for the state. Virginia’s C- infrastructure shows the Commonwealth is barely maintaining the status quo, and without significant change, it will be a struggle to maintain even the current gridlock of roads and frequent water pipe breaks without new solutions. In the Report Card, they give 3 solutions to raise Virginia’s grades:
1. Increase Leadership in Infrastructure Renewal: Virginia’s infrastructure is the responsibility of all our leaders. We need bold leadership and a vision for how strategic infrastructure investment can improve the current status quo.
2. Promote Sustainability and Resilience: Today’s infrastructure must meet the state’s needs in the best and worst of times, and also protect and improve the environment and our quality of life.
3. Develop Comprehensive Strategies: Virginia should prioritize and execute infrastructure strategies that put our investments where they are needed most, according to well-conceived plans that focus on comprehensive solutions that provide a good return on investment.
The Virginia legislature is just getting started, and there is no better time for them to take a second look at the infrastructure they are responsible for than now with a fresh update from the civil engineers who work on the state’s infrastructure every day.
? While some big steps were taken by the legislature in 2013 to bring renewed funding to transportation, may end up only keeping the status quo of transportation troubles across the state whether by car or transit. Another growing pain issue for Virginia is there are a lot of dams in the state (1,789 to be exact) and the number of people that now live behind old dams has increased with the growth of the state. The majority of dams were constructed between 1950 and 1975, making the average age more than 50 years old. With an increasing population, more houses and businesses are now below dams which means there’s more risk for damage and lives being lost if there was a failure. The good news is that Virginia has made a lot of progress in identifying and educating owners on how to fix dams that are considered high-hazard, but the bad news is that 141 of these high-hazard dams do not meet current dam safety standards, resulting in a grade of C for Virginia’s dams. Growth is also affecting schools as localities try to keep up with growing schools in some areas and older school maintenance in localities that seem to be losing students and residents.
Not only is Virginia growing, but its infrastructure is also starting to show its age with basic services like water, wastewater, and stormwater representing the old infrastructure bones of the cities. Virginia’s 2,830 public water systems providing drinking water to more than 7 million Virginians, and the Report Card found that many of these systems are 70 years or older and require significant asset renewal in the immediate future. The bad news is that funding is slim – from 2000 to 2012, the state only saw $200 million in Drinking Water State Revolving Funds, which is less than 10% of the commonwealth’s total investment needs. Wastewater needs have jumped 45%, and best estimates show $1 billion is needed to control overflows that pollute local waters. Also, stormwater systems are equally old, and surveys show about one-third of the infrastructure is older than 50 years and much of the remainder was built 25 to 50 years ago. While every bit of funding helps, the reality is Virginia’s water systems are only getting older each day and each dollar available is being split between trying to fix yesterday’s problems and today’s.
Growth and age are like a one-two punch to Virginia’s infrastructure causing a real struggle to maintain an acceptable level of infrastructure service for the state. Virginia’s C- infrastructure shows the Commonwealth is barely maintaining the status quo, and without significant change, it will be a struggle to maintain even the current gridlock of roads and frequent water pipe breaks without new solutions. In the Report Card, they give 3 solutions to raise Virginia’s grades:
1. Increase Leadership in Infrastructure Renewal: Virginia’s infrastructure is the responsibility of all our leaders. We need bold leadership and a vision for how strategic infrastructure investment can improve the current status quo.
2. Promote Sustainability and Resilience: Today’s infrastructure must meet the state’s needs in the best and worst of times, and also protect and improve the environment and our quality of life.
3. Develop Comprehensive Strategies: Virginia should prioritize and execute infrastructure strategies that put our investments where they are needed most, according to well-conceived plans that focus on comprehensive solutions that provide a good return on investment.
The Virginia legislature is just getting started, and there is no better time for them to take a second look at the infrastructure they are responsible for than now with a fresh update from the civil engineers who work on the state’s infrastructure every day.
Tags: dams, infrastructure, resilience, schools, stormwater, sustainability, Virginia, wastewater, water
No Comments »
Nevada Report Card Reveals a $15B Infrastructure Problem
December 16th, 2014 | By: Infrastructure Report Card
 During the past twenty years Nevada experienced one of the largest growth surges in the country and then one of the worst downturns from late 2008 through 2013. This roller coaster economy decreased funding levels and preventive maintenance suffered leaving many infrastructure systems underfunded. Hardest hit may be school facilities in both rural communities and cities. Nevada’s funding for maintaining schools stagnated and left a funding shortfall of over $5 billion during the next 5 to 10 years.
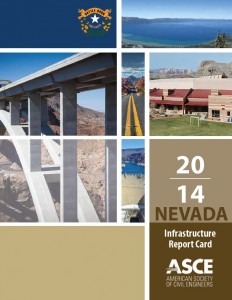
The 2014 Report Card for Nevada’s Infrastructure, released today by the Nevada Section of the American Society of Civil Engineers (ASCE), gave the state’s infrastructure a grade of “C-.” The Report Card identifies more than 15 billion in needs across Nevada’s critical infrastructure sectors over 20 years, including:
Dams and Flood Control:
During the past twenty years Nevada experienced one of the largest growth surges in the country and then one of the worst downturns from late 2008 through 2013. This roller coaster economy decreased funding levels and preventive maintenance suffered leaving many infrastructure systems underfunded. Hardest hit may be school facilities in both rural communities and cities. Nevada’s funding for maintaining schools stagnated and left a funding shortfall of over $5 billion during the next 5 to 10 years.
The 2014 Report Card for Nevada’s Infrastructure, released today by the Nevada Section of the American Society of Civil Engineers (ASCE), gave the state’s infrastructure a grade of “C-.” The Report Card identifies more than 15 billion in needs across Nevada’s critical infrastructure sectors over 20 years, including:
Dams and Flood Control:
- With the majority of funding for flood management coming from local gas and sales tax initiatives, there continues to be projected funding shortfalls upwards of $400 million.
- The state has 158 high hazard dams, which could lead to loss-of-life or significant property damage if dam failure occurs.
- The state budget for high hazard dams is nearly half the national average.
- In 2005, $500,000 of investments were made in aviation through the Nevada Aviation Trust Fund, resulting in an economic impact of over $20 million. However, since that time no state funding has been allocated into the Trust Fund to leverage federal funding.
- The Nevada Department of Transportation maintains 5,300 miles of state highways, which include many rural roadways within Nevada.
- Current funding levels provide only 60 to 70 percent of the required funding to maintain state highways.
- In Clark and Washoe Counties, 45 percent of schools are more than 30 years old.
- In other counties throughout the state, there are schools with campuses over 100 years old.
- Every dollar held back from school operation and maintenance budgets escalates emergency repair budgets 400 percent.
Tags: #HighwayTrustFund, dams, flood control, Nevada, report card, roads, schools
No Comments »
8 Things Worth Knowing About Montana’s C- Infrastructure
November 19th, 2014 | By: Infrastructure Report Card

Corroded Cast Iron Water Pipe, 75-100 Years Old, Cascade, MT
Source: Great West Engineering, Inc.
Tags: dams, infrastructure, Montana, pipes, report card, schools, water
No Comments »
New Report Estimates $200B Needed to Fix America’s Schools
March 7th, 2014 | By: Infrastructure Report Card
 After more than a decade, this week the National Center for Education Statistics (NCES) released an update to the Condition of America’s Public School Facilities report highlighting the condition of America’s school facilities. This report echoed the school facilities findings of the 2013 Report Card for America’s Infrastructure and showed the estimated need to bring school facilities into good repair was almost $200 billion. The report also estimates that on average about $4.5 million will need to be spent per school needing repairs. While the needs are significant, the findings also highlighted some positive changes – 60% of the sampled schools reported to have long-range educational facilities plans and 39% of schools have major renovations and modernization work planned in the next two years. While the study represents only a sample of America’s schools, it is encouraging to see the U.S. Department of Education release this much needed data on America’s schools.
Read the new report here.
After more than a decade, this week the National Center for Education Statistics (NCES) released an update to the Condition of America’s Public School Facilities report highlighting the condition of America’s school facilities. This report echoed the school facilities findings of the 2013 Report Card for America’s Infrastructure and showed the estimated need to bring school facilities into good repair was almost $200 billion. The report also estimates that on average about $4.5 million will need to be spent per school needing repairs. While the needs are significant, the findings also highlighted some positive changes – 60% of the sampled schools reported to have long-range educational facilities plans and 39% of schools have major renovations and modernization work planned in the next two years. While the study represents only a sample of America’s schools, it is encouraging to see the U.S. Department of Education release this much needed data on America’s schools.
Read the new report here.
Tags: condition, infrastructure, school facilities, schools
1 Comment »
Infrastructure Is the Missing Ingredient to Healthy School Lunches
December 30th, 2013 | By: Infrastructure Report Card
 The Kids’ Safe and Healthful Foods Project lead by The Pew Charitable Trusts and the Robert Wood Johnson Foundation released a report this December titled, Serving Healthy School Meals: U.S. Schools Need Updated Kitchen Equipment. They found that 55% of school food authorities (SFAs) need kitchen infrastructure changes at one or more schools to meet new healthy lunch requirements. That’s right – the majority of America’s schools need to fix their school’s infrastructure problems in order to serve up healthy school lunches every day.
Here’s a few of their key findings:
The Kids’ Safe and Healthful Foods Project lead by The Pew Charitable Trusts and the Robert Wood Johnson Foundation released a report this December titled, Serving Healthy School Meals: U.S. Schools Need Updated Kitchen Equipment. They found that 55% of school food authorities (SFAs) need kitchen infrastructure changes at one or more schools to meet new healthy lunch requirements. That’s right – the majority of America’s schools need to fix their school’s infrastructure problems in order to serve up healthy school lunches every day.
Here’s a few of their key findings:


Tags: infrastructure, infrastructure investment, report card, schools, state
No Comments »