California’s Orange County Infrastructure Isn’t Improving
July 21st, 2016 | By: America's Infrastructure Report Card
The Orange County Branch of the American Society of Civil Engineers today released its 2016 Orange County Infrastructure Report Card, grading 12 categories of the county’s infrastructure, resulting in an overall grade point average of “C+.” The Report Card was developed in collaboration with the UC Irvine Civil and Environmental Engineering Affiliates, an advisory group to the UCI Samueli School’s Civil and Environmental Engineering Department. A team of professional engineers from Orange County assessed the 12 categories, including Aviation (A-), Electric Power (C-), Flood Control & Levees (C-), Ground Transportation (C), Natural Gas (B-), Oil (B-), Parks, Recreation & Environment (C+), School Facilities (C), Solid Waste (B), Surface Water Quality (D+), Wastewater (B), and Water Supply (B). This is the fourth Orange County Infrastructure Report Card. The first, released in 2002, gave the county’s infrastructure a GPA of “C;” in subsequent releases in 2005 and 2010, the GPA has stayed constant at a “C+.” “In this first assessment of Orange County’s infrastructure since the 2008 recession, we found that while some areas have improved incrementally, others have declined, leaving our overall GPA stalled for more than a decade,” said Yaz Emrani, P.E., OC Infrastructure Report Card Chair. “Since our infrastructure works as a system, it’s important that Orange County increase investment so that we can move our infrastructure from ‘catching up’ to ‘ready for the future.’” The 2016 Orange County Infrastructure Report Card finds that much of the county’s infrastructure needs additional investment to keep up with demand. Of note:- While commercial traffic at John Wayne Airport approaches the current negotiated passenger limit of 10.8 million annual passengers until 2020, both general aviation and military demand fall short of meeting Orange County’s available capacity.
- Funding shortfalls for needed upgrades to bring regional flood control facilities in the county to its standards continue to be in excess of $2.7 billion.
- Deferred maintenance during the recent recession has exacerbated ground transportation needs. The existing funding sources are inadequate to meet the current and future demand, and it is estimated Orange County needs an additional $133 million annually.
- The condition of school facilities has declined in the past five years due to lack of funding.
- Due to increased volume of stormwater runoff during storm events, existing surface water quality infrastructure in Orange County does not have nearly the capacity to meet wet weather demands.
- Performing continuous and timely maintenance on the infrastructure to prolong use and minimize the need for costly repairs.
- Conducting comprehensive planning and long-term investment to ensure sound decisions about infrastructure.
- Preserving the environment while fostering economic growth and personal mobility.
D.C. Infrastructure Report Card Gives C- Overall, Lowest Grade to Levees
January 14th, 2016 | By: America's Infrastructure Report Card
The 2016 Report Card for D.C.’s Infrastructure is an independent review of the current state of infrastructure needs, capability and funding in D.C. by the National Capital Section of the American Society of Civil Engineers. The Report Card was written over the past year by ASCE members from the D.C. region who assigned the grades according to the following eight criteria: capacity, condition, funding, future need, operation and maintenance, public safety, resilience, and innovation. The report grades the infrastructure assets and is not a reflection of the agencies and professionals who work every day to solve infrastructure issues. It is a tool that shows the condition and importance of D.C.’s vital infrastructure assets that support our daily life or can interrupt our lives if we don’t maintain them. To put it another way, if you drive or ride in D.C., if you drink the water or flush a toilet in D.C., or if you just want infrastructure that works – this Report Card is for you. In the 2016 Report Card for D.C.’s Infrastructure, ASCE assessed 11 categories of infrastructure and found that 3 of them earned poor D grades, 6 earned mediocre C grades, and 2 earned B grades. Levees earned the lowest grade in the Report Card at a D-. Levees protect the capitol area from flooding as well as the Anacostia Bolling base, and both have earned “Unacceptable” ratings creating a need for emergency repairs and an additional $5 million would be needed to finish the work to protect the capitol area. Transit received a D grade due primarily to the condition of Metro system and the safety implications of a lack of consistent funding and focus on maintenance. While bright spots exist with new Metrobuses, Circulator bus success, and an innovative Capital Bikeshare, with 85% of D.C.’s commuters using Metro, it should be clear that this should be a priority not only in D.C. but also for each stakeholder in this system. While we know D.C. Roads are congested, the D+ grade for roads is in large part due to DDOT needing 4 times its current maintenance budget. For every dollar of need, there’s only a quarter to spend. School facilities earned a grade of C- with more than 49 schools reporting at least one “poor” condition structural element, impacting more than 14,000 students. However, almost half of D.C. schools have been modernized which show a tremendous leap in the right direction and a clear investment in D.C.’s future. Energy earned a C with $3 billion needed for electricity upgrades and $650 million need to replace 50-year old natural gas pipelines. Both water and wastewater were given grades of C+. With pipes’ median age being about 79 years old, we shouldn’t be surprised that there are 400 to 550 pipe breaks each year, but we’re starting to replace 1% per year and renew the clean drinking water infrastructure residents use. Wastewater work is happening right now to expand the capacity of our system that will not only prevent neighborhood flooding but improve the quality of the Anacostia River. Solid Waste earned a grade of C+. Our city’s growth is requiring an increase of trucks to take away our waste. While 10% more of it is recycled than a decade ago, we still need to make progress to reach the long-term goal of 45%. We have more Parks per person in D.C. than almost any place in the U.S. yet 50% of D.C.’s open spaces have challenges leading to a C+ grade. Rail received a B- grade due to the significant private investment of CSX in their rail infrastructure and the Virginia Avenue Rail Tunnel allowing 400,000 freight carloads to pass through D.C. While more capacity is need for rail and passengers, future plans being set today could serve D.C.’s needs and improve our congestion. Finally, D.C. Bridges received a B-, one of the highest grades, showing tremendous progress in reducing the structurally deficient bridges from 8% to 3% in just 3 years. The future will require consistent maintenance of older bridges reaching the end of their lifespan, but improvements like this show that diligent management, maintenance, and investment together create the changes we need to see. The Report Card shows us the condition and needs in a letter grade, but what is very clear when you read this report is that innovative solutions to our challenges, like DC Water’s Clean Rivers Project, are going to shape D.C.’s future if we let them. Yes, we have infrastructure challenges, but there are solutions to each of them and some are already on the way and some we need to support to make reality. We’re also going to need to get back to the basics – maintenance needs to be as essential to our budgets as water for hot coffee in the morning. With innovation and maintenance, we can prepare for the future and modernize the infrastructure that will serve us and future generations.Read the full 2016 Report Card for D.C.’s Infrastructure.
2015 Infrastructure Year in Review
January 4th, 2016 | By: America's Infrastructure Report Card
App Makes Contacting Legislators a Breeze
 In 2015, both Utah and Iowa rapidly passed transportation legislation reforms on the heels of the release of ASCE’s State Infrastructure Report Cards. In fact, ASCE has released a recent Report Card in 12 of the 15 states that have taken recent significant action on infrastructure. These states include: GA, ID, IA, KY, MD, NE, NH, NC, PA, SD, UT, VT, VA, WA, and WY.
Sharing the Report Card with Business and Industry Leaders
The Report Card for America’s Infrastructure continues to draw interest from business and industry groups nationwide. Almost 50 Report Card presentations have been given by ASCE leaders to groups ranging from the Dallas Regional Chamber of Commerce to the US/Canada P3 Forum to the Association of Actuaries. Request a presentation to your group by emailing reportcard@asce.org.
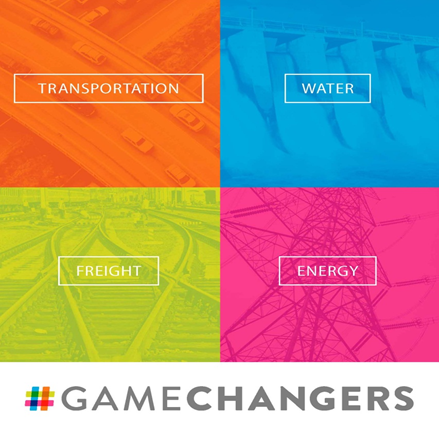 Highlighting #GameChangers and Solutions
In July, ASCE released Infrastructure #GameChangers report to highlight the innovative ways communities across the country are modernizing infrastructure. The report highlights trends in energy, freight, transportation and water infrastructure that are changing the way we design, plan, and build projects of the future.
Read the full ASCE 2015 Year in Review here.
Alabama’s Infrastructure Grades Are In
December 10th, 2015 | By: Becky Moylan
 The inaugural Report Card for Alabama’s Infrastructure, released today, reveals that Alabama’s aging infrastructure needs attention, especially its dams. As the only state without a dam safety program, Alabama does not have a complete inventory of all the dams in the state. Without this, Alabama is unaware of its dam safety risk. At the last survey in the 1980s, 147 high hazard dams were found and do not have Emergency Action Plans. Because of the unknowns surrounding Alabama’s dams, the Report Card graded it an “Incomplete,” signified by a question mark to demonstrate the uncertainty caused by of a lack of inventory and dam safety program.
With a cumulative grade point average of “C-,”Alabama’s infrastructure is only as strong as its weakest link. All of the highest grades are linked to the lowest grades in the report, as infrastructure works as a system. Plans and funding to address the state’s aging infrastructure assets fall significantly short of needs. Of note:
- Only an estimated 2% of all known dams in Alabama are being inspected for safety, maintained, and have emergency action plans in place for use in the case of an incident or failure. Without a dam safety program, communities that live under dams may not be aware of their risk, and emergency action plans for high hazard dams may not be in place to mitigate property damage and save lives in the case of a breach or failure.
- The majority of the state’s drinking water infrastructure was installed from the 1960s to the 1980s and operating beyond their useful design life.
- 1 in 3 wastewater utility providers statewide report having inadequate rate structures to cover normal operating expenses.
- Septic systems are commonly used in more rural parts of Alabama; 25% of the estimated 850,000 on-site septic systems are in failing or failed condition and could be polluting the community’s groundwater.
- Alabama has 1,388 structurally deficient bridges, ranking 15th most in the country, with many of these being bridges funded and maintained locally.
- Nearly 50% of interstate and state highways are in fair, poor, or very poor condition. Driving on rough and congested roads costs the average Alabama driver at least $300 a year in extra vehicle repairs.
- Much of the inland waterway lock and dam infrastructure within the state is breaking down and has passed the 50 year design service life or is approaching it. As an example, Coffeeville Lock and Dam has a throughput of 10 million tons in spite of vessel delay rates and durations in excess of 90% and 150 hours.
- Finish the dams inventory and pass legislation to create a dam safety program, establish emergency action plans, and use periodic safety inspections to keep communities safe.
- Prioritize routine maintenance to save money and prevent emergency repairs across all infrastructure types.
- Increase replacement of structurally deficient bridges, which are mostly owned and operated locally.
- Create state funding strategies that recognize the importance of functional drinking water, stormwater, and sewer infrastructure to support the economic development of Alabama.
New York Infrastructure Receives C- Report Card
September 29th, 2015 | By: America's Infrastructure Report Card
 In the inaugural 2015 Report Card for New York’s Infrastructure released today, the state received an overall grade of “C-” from the New York Council of the American Society of Civil Engineers. Assessing nine categories, the report finds that the state’s roads and bridges are among the categories most in need of repair, receiving grades of “D-” and “D+” respectively because of their state of deterioration and lack of adequate funding to improve conditions. In addition, wastewater received a low grade of “D.” The category of parks and solid waste both earned the highest grade of “B-.”
New York’s infrastructure faces several challenges and, in its current condition, the infrastructure system is a drag on the state’s economy. These challenges are highlighted in the Report Card:
- The three airports servicing New York City account for a majority of the nation’s airport delays. By the year 2030, JFK is expected to exceed its current traveler capacity by 30%, and ten other commercial service airports in New York will also exceed 60% of the current capacities.
- Of New York’s more than 17,000 bridges, the majority were built in the 20th century, with over 50% of bridges over 75 years old. Nationally, the average age of a bridge is 42 years.
- The average New York City area commuter, which accounts for half the state’s population, wastes 53 hours per year sitting in traffic.
- Poor road conditions and traffic congestion cost motorists a total of $6.3 billion statewide—an average of $477 per Syracuse motorists.
- The State of New York is only spending 20% of what is needed to modernize the wastewater system.
- One in every four of New York’s wastewater facilities are operating beyond their 30-year useful life expectancy.

- Create a prioritization program to assess the state’s transportation infrastructure needs starting from existing bridge asset management programs and based on accepted standards.
- Develop more consistent funding sources of funding for dams and support the creation of dam rehabilitation funding legislation at the federal and state levels for public and private owners of high hazard and intermediate hazard dams.
- As infrastructure is being rebuilt, make it more resilient and sustainable.
View the full report here.
Founded in 1852, the American Society of Civil Engineers represents more than 145,000 civil engineers worldwide and is America’s oldest national engineering society. ASCE’s 2013 Report Card for America’s Infrastructure, graded America’s cumulative GPA for infrastructure at a D+. The Report Card app for Apple and Android devices includes videos, interactive maps and info-graphics that tell the story behind the grades, as well as key facts for all 50 states.Can you hold your own on our infrastructure quiz? Let’s find out!
July 1st, 2015 | By: America's Infrastructure Report Card
“Test your Infrastructure I.Q.” is a quiz to help you learn more about our nation’s infrastructure. The quiz is a fun, interactive tool and covers 16 categories of American infrastructure: energy, schools, public parks & recreation, transit, roads, rail, ports, inland waterways, bridges, aviation, wastewater, solid waste, levees, hazardous waste, drinking water and dams. If you get a question wrong, you can find the answer and maybe learn a few other facts as well. What are you waiting on? It’s time to test your infrastructure I.Q.!
Be a Part of Infrastructure Week
April 29th, 2015 | By: Infrastructure Report Card
 The national week dedicated to highlighting the critical importance of investing in and modernizing America’s infrastructure systems, and the essential role infrastructure plays in our economy is May 11-15. The third-annual Infrastructure Week includes more than 30 events around the country from Alaska to Louisiana to New York.
A few of the events include:
- MONDAY in Washington, D.C. – Infrastructure Week Launch: Breaking through to the Future
- TUESDAY in Cleveland, OH – Follow the Flow: Celebrating Clean Water Investments in the Cleveland Metro
- WEDNESDAY in Pittsburgh, PA – Pittsburgh on the Move and Infrastructure Advocacy Day in Washington, D.C.
- THURSDAY in New Orleans, LA – Infrastructure Delivers More Than You Think with Tour of Port NOLA
- FRIDAY in Washington, D.C. – Building Resilience through New Financing Vehicles
Tags: infrastructure, planes, ports, report card, roads, states, trains
No Comments »
What You Don't Know About Vermont's Dams
April 20th, 2015 | By: Infrastructure Report Card
What you probably don’t know about Vermont’s dams is that no one knows exactly what the condition of these structures is. Just as much as poor condition, it’s the lack of information that poses a risk to Vermont. This is the lesson Jessica Louisos, a civil engineer with the Waterbury firm Milone & MacBroom and a co-author of the Report Card for Vermont’s Infrastructure by the American Society of Civil Engineers, shares in a new PBS interview.Tags: dams, legislation, report card, Vermont
No Comments »
It's Time Again to GROW America
April 1st, 2015 | By: America's Infrastructure Report Card
 During a recent interview with Politico’s Mike Allen, U.S. Secretary of Transportation Anthony Foxx noted that the nation’s transportation system is “in a huge ditch.” Yesterday, the U.S. Department of Transportation (USDOT) unveiled its idea on how to get America out of that ditch with their GROW America proposal. If the name sounds familiar, it’s because that was the original title of the previous federal surface transportation program proposal unveiled by the Obama Administration last year. The key difference this year is that the Administration has identified a specific funding source, taxing overseas corporate profits, to pay for the $478 billion, six-year bill.
The GROW America proposal, among other things, would:
• Increase the nation’s overall investment in transportation by 45%, with a 29% increase in highway spending and a 76% increase in transit spending;
• Provide $18 billion for a multi-modal freight program that strengthens America’s exports and trade;
• Include $28.6 billion for passenger rail programs;
• Double funding for the TIGER competitive discretionary grant program and create a new $6 billion highway and transit competitive grant program; and
• Double the Transportation Infrastructure Finance and Innovation Act (TIFIA) program which encourages utilization of innovative financing mechanisms.
USDOT published a state-by-state impact of the benefits of GROW America investment which included ASCE Report Card data on state needs and economic impacts. The GROW America Act is an important legislative marker that seeks to define the debate about the need to increase federal infrastructure investment in order to meet current and future capacity and maintenance challenges. Funding certainty is important to states for delivering projects, as the six-year time frame supports, but of additional importance is the need to increase overall federal funding. The current revenue rates have not risen since 1993 and since that time the cost to deliver projects has increased. Since 1993, in real terms, the average federal highway dollar has lost over a third of its purchasing power. Please urge your members of Congress to act now to grow the federal surface transportation program and fix the Highway Trust Fund.
Tags: congress, highway trust fund, infrastructure, report card, transportation
No Comments »
Utah's Infrastructure Receives First Report Card
February 23rd, 2015 | By: Infrastructure Report Card
Join the Utah Section of the American Society of Civil Engineers (ASCE) for the release of the 2015 Report Card for Utah’s Infrastructure on Tuesday, Feb. 24. The report includes evaluation of Utah’s bridges, canals, dams, drinking water & supply, hazardous waste, levees, roads, solid waste, transit, and wastewater & stormwater. WHAT: Press Release of the 2015 Report Card for Utah’s Infrastructure WHO: Utah Section of the American Society of Civil Engineers David Eckhoff, P.E., PhD, American Society of Civil Engineers Andrew Gruber, Executive Director, Wasatch Front Regional Council Ari Buening, COO, Envision Utah WHEN: Tuesday, Feb. 24, 2015, 10 a.m. WHERE: Utah State Capitol Presentation Room, First Floor, Salt Lake, UT WHY: Infrastructure has a direct impact on our lives every day—from the water we drink, to the roads and rails we travel. Infrastructure is vital to our economy, security, recreation and safety. Will Utah’s infrastructure systems make the grade? Can’t attend but want to see the Report Card tomorrow? Find it here.Tags: infrastructure, report card, Utah
No Comments »


 */ ?>
*/ ?>


