Author Archive
The Little Program that Could — If Funded
June 11th, 2013 | By: America's Infrastructure Report Card
The House Science Committee was quick to take notice of the tragedy that took place in Oklahoma and responded by calling a hearing on less than a week’s notice to review federal efforts to reduce the impacts of windstorms. In addition to the tornado outbreak, the hearing focused on a small government program, the National Windstorm Impact Reduction Program or NWIRP. Created with the support of ASCE in 2004, the multi-agency program is designed to coordinate the wind hazards research and mitigation efforts of the National Institute of Standards and Technology (NIST), the Federal Emergency Management Agency (FEMA), the National Oceanic and Atmospheric Administration (NOAA), and the National Science Foundation (NSF). The general consensus of the members of the Science Committee and the witnesses was the program could have a major impact in reducing the loss, both terms of human life and economic, from sever windstorms. None of the members of the Committee present, nor any of the three witnesses, opposed the program. However, since its creation in 2004, there has been no appropriated funding for the program and in September of 2009 authorization for the program expired. Efforts to reauthorize NWIRP and its larger, more established, better funded sister program, the National Earthquake Hazards Reduction Program (NEHRP), have been ongoing since 2009. Spanning five years and three Congresses, we are once again facing an uphill battle to reauthorize the two programs and, in the case of NWIRP, fund a program that everyone seems to support. The question seems to be, why? This is the kind of program Congress used to routinely reauthorize on schedule. However, the program, like many others, has become a victim of competing priorities, and a more partisan Congress. There is a long list of reason these two programs have not been reauthorized, most having nothing to do with their merits. The simple fact is, the Federal government annually spends billions on disaster relief, and seemingly baulks at spending millions in an effort to reduce the need to spend the billions. Meanwhile, as efforts get underway to rebuild in More, Oklahoma, if recent history is any indication, it will be rebuilt to the same building codes which existed before the recent tornado, just as was done in 1999 and 2003, with just as predictable of results. As David Prevatt, Ph.D., P.E., M.ASCE, stated during the hearing, “this is not that complicated, windstorms are possibly the only natural disasters whose impact on humans could be mostly resolved by proper research.” A full webcast of the hearing is available here.
How WRDA Can Reduce Risks and Costs of Future Floods
June 6th, 2013 | By: America's Infrastructure Report Card
In a Monday briefing, representatives from the Association of State Floodplain Managers, National Association of Flood and Stormwater Management Agencies, and the Nature Conservancy gathered to discuss the opportunities in the proposed WRDA bill to reduce flood risks and the potential damages from flood disasters. The nation’s dam and levee system is characterized by low system integration, having been constructed in an ad hoc manner, with little to no regard for the effects beyond the immediate applications. Because dams and levees are often constructed by localities to serve the needs of their constituents, there is no full register of all the existing dams and levees in the United States. Many of the known dams and levees are reaching or exceeding their designed operating age of 50 years, creating a pressing need for a National Levee Safety Program. Recently built dams are constructed to withstand the 100 year flood. However, according to Dr. Professor Mathias Kondolf of U.C.-Berkeley, a house with a 30 year mortgage built in a floodplain area has an aggregate 26 percent chance of being flooded over the course of the mortgage. Since they are living under the protection of a 100 year dam, houses in these areas often do not have flood insurance and have not taken steps to protect themselves, such as elevating the structure, from flood waters. Dr. Kondolf continued on to say that the aim of modern dams is to “filter out the small floods,” but that they do not protect from “the big ones.” In many areas historically prone to flooding and flood damage, the presence of protective structures has actually drawn increased levels of business and personal development. This risk intensification was borne out in areas damaged by Superstorm Sandy and Hurricane Katrina when levees holding back ocean water failed. Floods, in their natural form, are healthy for and necessary parts of an ecosystem. In fact, without the floods of the Mississippi and Missouri rivers carrying silt and material, the Mississippi Delta around which New Orleans is built would not exist. Disaster arises when a dam or levee is built and people are allowed to build and live in what was the floodplain. When a flood does breach the wall, the costs can be astronomical. The hazards out flood disasters can be mitigated by analyzing and appropriately managing flood-vulnerable areas. By adopting policies known in the Netherlands as “room for the rivers,” the effects of floods on human activities can be mitigated. Some recommendations in accord with this are to set levees further back from the main flow of water, thus allowing any flood to proceed more naturally, or to designate areas of land that to be used as flood bypasses during times of high flood waters. However, the availability of these lands during dry times can induce development. All representatives present at Monday’s briefing agreed that, as a rule, “non-structural” approaches such as giving the river room, building houses above flood level, and creating natural drainage channels around cities are best suited to provide long-term protection. Ultimately, WRDA is an essential bill to plan and manage the nation’s waterways and flood preparedness. It is necessary to establish national guidelines for dams and levees, provide money to repair levees, and establish a comprehensive database of levees in the country. Cost-sharing, imposing per-project caps, and creating a national floodplain management plan will allow the legislation to provide the greatest amount of benefit.
Tags: congress, dams, levees, natural disasters, water infrastructure, water resources development act
1 Comment »
Get to Know North Carolina’s Mediocre Infrastructure
June 5th, 2013 | By: America's Infrastructure Report Card
 Today, North Carolina’s civil engineers released a new Infrastructure Report Card. After spending a year diving into the details of the state’s infrastructure – from bridges to beaches to dams – they determined that North Carolina’s infrastructure only deserved a mediocre C grade. Like many areas of the country, North Carolina has some work to do to make sure maintenance gets done, aging parts of the system get a modern overhaul, and the infrastructure keeps up with the state’s growth.
The state-wide report examined eleven categories of infrastructure, grading their capacity, resiliency, funding, and reliability. Here’s what they found:
Today, North Carolina’s civil engineers released a new Infrastructure Report Card. After spending a year diving into the details of the state’s infrastructure – from bridges to beaches to dams – they determined that North Carolina’s infrastructure only deserved a mediocre C grade. Like many areas of the country, North Carolina has some work to do to make sure maintenance gets done, aging parts of the system get a modern overhaul, and the infrastructure keeps up with the state’s growth.
The state-wide report examined eleven categories of infrastructure, grading their capacity, resiliency, funding, and reliability. Here’s what they found:
- Aviation earned a D+, in part due to an estimated $763 million needed to bring all airports in the system to a state of good repair.
- Beaches and Inlets were awarded a C-. Many shoals and inlets are functioning at significantly less than authorized depths. Continued erosion of federal and state funding has a significant impact N.C.’s beaches and inlets.
- Bridges earned a C-. North Carolina’s bridges require $281 million more per year in order to make significant strides in raising the grade of North Carolina bridges.
- Dams earned the lowest grade of a D. Ten percent of North Carolina’s high hazard dams are deficient and only 34 percent have Emergency Action Plans. One-third of North Carolina’s dams are over 50 years old.
- Drinking Water earned a C+. North Carolina has over 530 public water systems which serve approximately 7.3 million North Carolinians (75 percent of the state’s population).
- Energy was awarded the highest grade in the report of a B+. North Carolina has a solid foundation of energy and energy infrastructure to meet its current and 20-year planning horizon needs.
- Rail earned a C+, in part due to only 30 percent of the state’s short lines being able to accommodate new, heavier rail cars. It is estimated that freight rail investment needs over the next 25 years will total $545 million.
- Roads earned a C. The scale of the state maintained highway network, current economic circumstances, and the trend of reducing the state transportation agency’s resources and personnel have been challenges to providing and maintaining a sustainable quality of service.
- Schools earned a C. Over 58 percent of North Carolina schools will require renovations in the next five years. Additionally, approximately 10 percent of students are in mobile classrooms. The projected cost to meet facility needs for the next five years is approximately $8.2 billion.
- Stormwater earned a grade of C-. Most of North Carolina’s population lives in communities that have no dedicated source of funding to improve stormwater quality. Statewide sources of funding such as the N.C. Clean Water Management Trust Fund are being reduced and North Carolina’s communities have fewer and fewer options when trying to address their stormwater improvement needs.
- Wastewater earned a C. North Carolina has documented a need of over $4 billion of additional wastewater infrastructure investment needs through the year 2030. These funds are needed to replace aging facilities, comply with mandated Clean Water Act regulations, and keep pace with economic development.
Tags: bridges, continuing education, dams, energy, infrastructure, infrastructure report card, ports, rail transportation, roads, state report cards, transportation, wastewater, water infrastructure
No Comments »
TCC Members Hit Capitol Hill
June 5th, 2013 | By: America's Infrastructure Report Card
 Members of the Transportation Construction Coalition hit Capitol Hill this morning as a part of the organization’s annual Fly In. With over 500 construction, engineering, and equipment experts coming into Washington DC, the plan it to make Members of Congress understand the dire impact on their states, districts and the National economy if Congress fails to take action to address the long term financial solvency of the Highway Trust Fund. Fly In attendees will also tell Congress that a timely reauthorization of MAP-21 must be a priority.
National Dam Safety Awareness Day
May 31st, 2013 | By: America's Infrastructure Report Card
Today marks the 124th anniversary of the Johnstown Flood , the the result of the catastrophic failure of the South Fork Dam, which was situated 14 miles upstream of the town of Johnstown, Pennsylvania. The dam failed after a period of heavy rainfall, however it was not properly maintained for years and in fact modified in ways that threatened the integrity of the structure. On the afternoon of May 31, 1889 the dam failed after workers spent hours trying to save the structure, releasing 12,000 cubic meters of debris-filled water each second. Towns below the dam were never properly notified of the failure and evacuations never took place, with the result being the loss of 2,209 lives, thousands homeless, and $17 million in damages ($425 million in today’s dollars).
Since the time of the Great Flood of 1889 the nation has created the National Dam Safety Program and put an emphasis on emergency action plans and proper dam inspections and regulations. However, ASCE’s 2013 Report Card for America’s Infrastructure graded the nation’s dams with a D. While we no longer see the sever blunders that lead to the failure of the South Fork Dam in 1889, the average age of the 84,000 dams in the country is 52 years old. With an increasing population and greater development below dams, the overall number of high-hazard dams continues to increase, to nearly 14,000 in 2012. The Association of State Dam Safety Officials estimates that it will require an investment of $21 billion to repair these aging, yet critical, high-hazard dams.
Under FEMA’s leadership, the National Dam Safety Program is dedicated to protecting the lives of American citizens and their property from the risks associated with the development, operation, and maintenance of America’s dams. Unfortunately, the National Dam Safety Program expired in September 2011 and Congress has yet to reauthorize this small, yet vital program. Since today is National Dam Safety Awareness Day, which was first established in 1999, it seems like the perfect time to urge Congress to reauthorize the National Dam Safety Program. Congressmen Sean Patrick Maloney (D-NY) and Chris Gibson (R-NY) introduced the Dam Safety Act of 2013 (H.R. 1489) last month, which would reauthorize the program at $10.5 million annually. ASCE has endorsed the legislation and urges Congress to either pass the bill as a standalone piece of legislation, or include it in a greater Water Resources Development Act. The language was already passed as part of the Senate Water Resources bill, so it is now time for the House to do the same. The nation cannot risk another catastrophic dam failure when preventative measures can easily be taken.
, the the result of the catastrophic failure of the South Fork Dam, which was situated 14 miles upstream of the town of Johnstown, Pennsylvania. The dam failed after a period of heavy rainfall, however it was not properly maintained for years and in fact modified in ways that threatened the integrity of the structure. On the afternoon of May 31, 1889 the dam failed after workers spent hours trying to save the structure, releasing 12,000 cubic meters of debris-filled water each second. Towns below the dam were never properly notified of the failure and evacuations never took place, with the result being the loss of 2,209 lives, thousands homeless, and $17 million in damages ($425 million in today’s dollars).
Since the time of the Great Flood of 1889 the nation has created the National Dam Safety Program and put an emphasis on emergency action plans and proper dam inspections and regulations. However, ASCE’s 2013 Report Card for America’s Infrastructure graded the nation’s dams with a D. While we no longer see the sever blunders that lead to the failure of the South Fork Dam in 1889, the average age of the 84,000 dams in the country is 52 years old. With an increasing population and greater development below dams, the overall number of high-hazard dams continues to increase, to nearly 14,000 in 2012. The Association of State Dam Safety Officials estimates that it will require an investment of $21 billion to repair these aging, yet critical, high-hazard dams.
Under FEMA’s leadership, the National Dam Safety Program is dedicated to protecting the lives of American citizens and their property from the risks associated with the development, operation, and maintenance of America’s dams. Unfortunately, the National Dam Safety Program expired in September 2011 and Congress has yet to reauthorize this small, yet vital program. Since today is National Dam Safety Awareness Day, which was first established in 1999, it seems like the perfect time to urge Congress to reauthorize the National Dam Safety Program. Congressmen Sean Patrick Maloney (D-NY) and Chris Gibson (R-NY) introduced the Dam Safety Act of 2013 (H.R. 1489) last month, which would reauthorize the program at $10.5 million annually. ASCE has endorsed the legislation and urges Congress to either pass the bill as a standalone piece of legislation, or include it in a greater Water Resources Development Act. The language was already passed as part of the Senate Water Resources bill, so it is now time for the House to do the same. The nation cannot risk another catastrophic dam failure when preventative measures can easily be taken.
Can Smart Growth Strategies Save Money for Cities?
May 30th, 2013 | By: America's Infrastructure Report Card
As cash-strapped cities and states look for ways to maintain and modernize their infrastructure, a new study suggests that smart growth development can help the bottom line. Recently Smart Growth experts compiled results from 17 studies, showing the revenue potential of “smart growth” development strategies. The new report, Building Better Budgets: A National Examination of the Fiscal Benefits of Smart Growth Development, provided three major conclusions about smart growth development: 1. It costs about one-third less for upfront infrastructure.
Suterbrook Village – An Island of Urbanity that Actually Works
House Subcommittee Grills Amtrak over Federal Subsidies and Operating Losses
May 24th, 2013 | By: America's Infrastructure Report Card
The House Subcommittee on Railroads, Pipelines, and Hazardous Materials heard testimony on Tuesday from witnesses regarding federal subsidies for passenger rail service provided by Amtrak. Over the past few years, Amtrak’s ridership has increased dramatically, increasing the revenue stream, and reducing reliance on federal subsidies. Despite these improvements coming from the Passenger Rail Investment and Improvement Act (PRIIA), Amtrak was $600 million in the red this past year, and the losses incurred by long-distance rail routes actually increased by 11%. Joseph Boardman, CEO of Amtrak, in detailing some of the major cost drivers for Amtrak, pointed to rising labor costs as a primary factor in Amtrak’s costs. According to his testimony to the Subcommittee, between 50% and 66% of all Amtrak’s costs come from the payment of wages and benefits. These costs are going to continue to increase as Amtrak is currently in negotiation with the unions to provide a 15% pay increase to crewmembers over the next five years. However, revenue is on the uptick for Amtrak. Under PRIIA, the federal government mandated that states would be required to contribute to funding for Amtrak, relieving some of the burden from the federal government. In 2013, states contributed just under $200 million. That amount is projected to increase to over $300 million in 2014. Mr. Boardman heavily emphasized the importance of maintaining funding for long-distance railroads, pointing out that in almost half of the system—223 of the 500 stations and 23 of the 46 states — long-distance railroads are the only rail service provided. Because these routes cross state boundaries and are essential to the cohesion of the whole rail system, Mr. Boardman declared that maintaining them was “clearly a federal responsibility.” Ross Capon, CEO of the National Association of Railroad Passengers, also emphasized the importance of federal subsidies. He pointed out that, even though the Northeast Corridor is one of the only profitable sections of Amtrak, it is at or near capacity, and without government dollars, he predicted a rapid “death spiral” for it were those funds to be removed. Pointed questions came from many members of the committee, including former Transportation and Infrastructure Chairman John Mica. Calling Amtrak a “Soviet style rail system,” Mica suggested that as long as it continued in this fashion, Amtrak would never be able to show a profit. He then pointed out that in many sections of the system, the loss per person to the federal government had actually increased between 2011 and 2012. Representative Hanna followed by asking why if ridership was increasing and demand was inflexible with regards to price, there remained a preference to rely on federal subsidies to maintain low fares instead of raising prices. Ross Capon and Joseph Boardman agreed that prices were high enough currently that any further increase in price would drive passengers away. While challenges remain, the hearing showed that by controlling for its main cost drivers, perhaps Amtrak can keep showing progress towards breaking even. Photo courtesy: http://netrightdaily.com/2011/01/dont-subsidize-amtrak-just-let-the-free-market-work/Delaney Introduces Bipartisan Infrastructure Bill
May 22nd, 2013 | By: America's Infrastructure Report Card
Congressman John Delaney today introduced the bipartisan Partnership to Build America Act. The legislation would finance the rebuilding of our country’s transportation, energy, communications, water, and education infrastructure through the creation of the American Infrastructure Fund (AIF) by using repatriated corporate earnings as well as through utilizing public-private partnerships. The AIF would provide loans or guarantees to state or local governments to finance qualified infrastructure projects and is estimated to leverage an initial $50 billion at a 15:1 ratio, therefore providing $750 million in investment. ASCE strongly supports the Partnership to Build America Act as one way to deal with the nation’s ever growing infrastructure challenges. By creating an infrastructure fund using repatriated corporate earnings, as well as through the use of public-private partnerships, the legislation is creating another innovative financing source for our nation’s infrastructure. It will take innovative financing, to work in partnership with more traditional funding mechanisms in order to raise the grades for our nation’s infrastructure. Furthermore, improving the condition of our nation’s aging roads, bridges, power lines, sewer systems, ports and waterways is critical to protecting 3.5 million jobs according to ASCE’s report, Failure to Act: The Impact of Current Infrastructure Investment on America’s Economic Future. If investments in infrastructure aren’t made at this time, families will have a lower standard of living, businesses will be paying more and producing less and our nation will lose ground in a global economy. The nation’s deteriorating infrastructure will cost the American families $3,100 annually in lost income and suppress the growth of the country’s Gross Domestic Product (GDP) by $3.1 trillion by 2020. Therefore, it is critical for Congress to continue to find new, and innovative ways, to invest in infrastructure programs. ASCE looks forward to working with Congress on the passage of the Partnership to Build America Act and applauds Congressman Delaney for continuing the conversation on how we invest in the nation’s infrastructure.Tags: congress, infrastructure
No Comments »
Kansas and Missouri Both Earn C- in New State Report Cards
May 22nd, 2013 | By: America's Infrastructure Report Card
According to civil engineers in Kansas and Missouri, the states have an imperative to improve their inadequate infrastructure systems if they hope to boost their economies. Today marks the release of both the 2013 Report Card for Missouri’s Infrastructure and the 2013 Report Card for Kansas’s Infrastructure. Engineers in each state spent the last year analyzing 9 and 11 categories in Kansas and Missouri respectively, assigning cumulative grades of C- for both.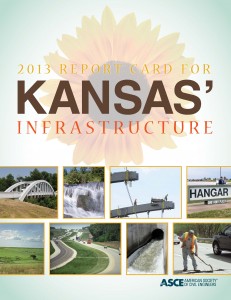 Tom Jacobs, P.E., Report Card Committee Co-Chair for Kansas, accompanied the news by impressing upon elected officials the need to do better. “To our elected officials I only ask this question: is a C- good enough? I certainly hope not. We did not elect you to build a C- state. Our roads, levees, bridges and dams need long-term investment in order to have long-term success.”
“Our state’s future is dependent upon whether we can attract businesses and allow them to thrive” said Steve Randolph, P.E., President of the ASCE St. Louis Section. “A C- means that businesses cannot reliably and effectively move goods in an ever-changing global marketplace. If we are serious about creating jobs and building a strong economy, then we must also be serious about investing in our infrastructure.”
Each state’s grade was the aggregate of various individual sectors, ranging from Aviation and Energy, to Levees and Wastewater. The grades for each state are broken down as follows:
KANSAS
Tom Jacobs, P.E., Report Card Committee Co-Chair for Kansas, accompanied the news by impressing upon elected officials the need to do better. “To our elected officials I only ask this question: is a C- good enough? I certainly hope not. We did not elect you to build a C- state. Our roads, levees, bridges and dams need long-term investment in order to have long-term success.”
“Our state’s future is dependent upon whether we can attract businesses and allow them to thrive” said Steve Randolph, P.E., President of the ASCE St. Louis Section. “A C- means that businesses cannot reliably and effectively move goods in an ever-changing global marketplace. If we are serious about creating jobs and building a strong economy, then we must also be serious about investing in our infrastructure.”
Each state’s grade was the aggregate of various individual sectors, ranging from Aviation and Energy, to Levees and Wastewater. The grades for each state are broken down as follows:
KANSAS
- Aviation earned a C. Twenty-five percent of Kansas’ airports with paved runways need improvement. System-wide, only 36 percent of Kansas airports meet the benchmark for clear approaches to the primary runway.
- Bridges were awarded a D+, in part due to Kansas’s nearly 3,000 structurally deficient bridges. Only five states have more structurally deficient bridges than Kansas.
- Dams earned the lowest grade of a D-. Of the state’s 6,087 dams, 230 are classified as high hazard, meaning failure would likely lead to loss of life and significant property damage.
- Drinking Water earned a C. Presently, there are no dedicated revenue streams to support the necessary funding to support the Kansas’ Water Plan initiatives.
- Energy was awarded a C-. Kansas ranks in the top ten for crude oil production and has one of the richest natural gas fields in the United States.
- Levees earned a C-, in part due to the fact that there are no consistent standards or regulations governing the maintenance and ongoing inspection of levees in the State.
- Railroads earned a C. Kansas has the sixth largest rail system in the United States. Funding sources for the long-term investments have not been identified yet.
- Roads earned the highest grade of a C+. A decrease in federal and state funding levels has a direct impact on the quality of roads in Kansas, from safety to pavement condition.
- Schools earned a C+. There was a huge expansion in the 1950s where the amount of schools in Kansas more than doubled. These building are now 60 years old and many are in need of major repair or replacement.
 MISSOURI
- Aviation earned a C grade, in part due to the fact that over the next five years, a shortfall of slightly more than $81 million is anticipated for MO’s aviation sector.
- Bridges was awarded a C-.Missouri has 339 functionally obsolete bridges (12 percent of Missouri’s bridge inventory). Missouri has the 19th lowest percentage in the country.
- Dams received the lowest grade of D-. Missouri has 1,588 high hazard dams (meaning failure would likely lead to loss of life and significant property damage), and 3,511 significant or low hazard dams.
- Drinking Water earned a C-. Even though Missouri has an abundance of water for serving its communities, its aging water treatment and distribution systems are struggling to keep up with current demand.
- Energy earned a D+. Missouri’s shift away from coal and toward more sustainable energy systems, is requiring increased investment in generation facilities, transmission and distribution networks.
- Inland Waterways was awarded a D. Each year the Missouri River carries 8 million tons of cargo, throughout its navigable length. The Mississippi River carries 58 million tons to the mouth of the Missouri River, and 189 million tons to Baton Rouge, Louisiana.
- Levees were awarded a C-. It is estimated that 85 percent of Missouri’s levees are not a part of the National Levee Database.
- Railroads received a C. In order to meet future travel demands, greater funding and much greater support from the State will be necessary.
- Roads earned a C. The last time the state of Missouri passed a piece of transportation funding-related legislation was in 2004. The funding generated by the bill allowed for 2,200 miles of the state’s busiest highways to be smoother and safer, sped up 55 critical highway projects and allowed $1.6 billion in new construction.
- Schools earned a C, in part due to education budget cuts and a lack of long-term funding.
- Wastewater earned a C-. The state of Missouri has a network of established wastewater systems that have been functionally serving citizens for over 50 years in some locations.

Washington State Report Card Released Today!
May 21st, 2013 | By: America's Infrastructure Report Card
Washington’s transportation infrastructure has significant needs according to a new report by the Seattle Section of the American Society of Civil Engineers (ASCE). The new report, titled the 2013 Report Card for Washington’s Infrastructure, awarded Washington State’s infrastructure a C due to a lack of planned funding and inadequate maintenance. “We cannot hope to have an A+ economy, with a C level infrastructure,” said James Chae, P.E., M.ASCE, president of the Seattle Section. “Washingtonians need to realize that our ailing infrastructure hurts our wallets and our livelihoods. In fact, travel delays cost Washington State drivers and businesses more than 32 million hours a year, valued at over $1.1 billion annually.” According to the Report Card, Washington’s roads and transit systems performed the worst of all evaluated sectors, both returning scores of D+. Nine different categories were graded:- Aviation earned a C grade as aging facilities, cumbersome land-use policies, and a lack of available funds have detrimental impacts on Washington’s aviation system.
- Bridges were awarded a C-, in part due to the nearly 400 structurally deficient bridges in Washington State. 36 percent of Washington’s bridges are past their design life of 50 years.
- Dams earned the highest grade in the Report Card: a B. However, close to 40 percent of Washington’s dams are categorized as significant or high hazard dams. A large proportion of dams in Washington are over 50 years old, and development downstream of many dams has significantly increased since the dams were built.
- Drinking Water earned a C-. While only a small percentage of the state’s population is served by smaller water systems serving 25 people or less, they account for 85 percent of the state’s water systems and are only regulated at the county level.
- Rail was awarded a C-, due to the concerning condition of some congested corridors and short line rails. By 2030, $2 billion worth of improvements are needed and 90 percent of these projects are unfunded.
- Roads earned one of the lowest grades in the Report Card: a D+. The system, much of which was built 50 to 60 years ago, is struggling under increasing traffic and financial pressure. Reduced maintenance has caused an 11 percent increase in state highway paving backlog and a 32 percent decrease in county road paving.
- Schools were awarded a mediocre grade of C, in part due to the fact that by 2018, 56 districts are anticipated to be under capacity by about 50,000 students. During the last decade, districts who attempt to raise capital for school facilities locally have faced a 50% failure rate with voters.
- Solid Waste/Hazardous Waste earned a C. Over 16 million tons of waste was generated in Washington by citizens, industry, and manufacturing in 2010.
- Transit earned a D+ grade, in part due to the pace of transit maintenance and expansion not keeping up as transit competes for scarce transportation dollars at the state and federal level.