Author Archive
Half of States Have a Gas Tax Policy That's a Decade Old
April 3rd, 2014 | By: Infrastructure Report Card
The Institute on Taxation and Economic Policy (ITEP) released a new chart this week clearly showing how long it’s been since many states have changed their gas tax policy. In about half the states, it has been a decade or more since they’ve changed their gas tax policy in spite of the changing costs for materials, machines, or projects overall. While a minor policy like indexing or switching to a “variable-rate” tax may seem small, consider what we all learned from the hit movie Office Space – even a fraction of a penny can add up to a lot over time. If we’re going to keep up with America’s growth, we need to start counting our pennies a bit differently. Here’s a few of the other key findings from this chart:
• Twenty-four states have gone a decade or more without an increase in their gas tax rate.
• Sixteen states have gone two decades or more without a gas tax increase.
• Seven states have not seen an increase in their gas tax rate since the 1980’s or earlier: Alaska, Virginia, Oklahoma, Iowa, Mississippi, South Carolina, and Tennessee.
• Among the thirty-two states levying a “fixed-rate” gas tax, the average length of time since the last gas tax increase is 17.2 years.
• Most states levying a more sustainable “variable-rate” gas tax, by contrast, have seen their gas tax rate rise some time in the last twelve months
Read the full ITEP report here.
Here’s a few of the other key findings from this chart:
• Twenty-four states have gone a decade or more without an increase in their gas tax rate.
• Sixteen states have gone two decades or more without a gas tax increase.
• Seven states have not seen an increase in their gas tax rate since the 1980’s or earlier: Alaska, Virginia, Oklahoma, Iowa, Mississippi, South Carolina, and Tennessee.
• Among the thirty-two states levying a “fixed-rate” gas tax, the average length of time since the last gas tax increase is 17.2 years.
• Most states levying a more sustainable “variable-rate” gas tax, by contrast, have seen their gas tax rate rise some time in the last twelve months
Read the full ITEP report here.
Tags: infrastructure, policy, state, tax, transportation
No Comments »
New Report Card for Illinois' Infrastructure Shows Progress
April 2nd, 2014 | By: Infrastructure Report Card
 The 2014 Report Card for Illinois’ Infrastructure was released today by the Illinois Sections of the American Society of Civil Engineers (ASCE) at the Illinois Statehouse.
A panel of professional civil engineers throughout the state graded each infrastructure category according to the following eight criteria: capacity, condition, funding, future need, operation and maintenance, public safety, resilience, and innovation. In 2010, the infrastructure grade for Illinois was a D+, reflecting delayed maintenance and underinvestment across most categories. In the 2014 Report Card for Illinois’ Infrastructure, the state’s infrastructure G.P.A. jumped to a C- showing the progress made with leadership and solid infrastructure programs.
Over the past four years since the 2010 Report Card for Illinois’ Infrastructure, leaders at the state level and in Illinois’ cities—large and small—have started to make some steps to rebuild their aging infrastructure. Programs such as CREATE have started unclogging rail and traffic bottlenecks and the Illinois Jobs Now! effort by the state provided $31B to start fixing Illinois’ biggest infrastructure problems. These efforts have paid off and both the Rail and Drinking Water grades have gone up since the last Report Card. Plans like Chicago’s commitment to replace and repair aging water pipes shows how “thinking big” can create even bigger results.
But while some of the grades have gone up, Illinois’ infrastructure isn’t a B student yet. Aging infrastructure and delayed maintenance have taken their toll. Illinois’s average bridge is 40 years old which is close to retirement age for a bridge, Chicago has been replacing water pipes put in when Ulysses Grant was President, and more and more people and goods spend time stuck in traffic on Illinois’ roads and rails.
Let’s Raise the Grades
Illinois’s infrastructure touches almost every aspect of citizens’ daily life—from your neighborhood roads, to your phone, to the community school, to the new south suburban airport. In 2014, we need to be visionary but realistic about our infrastructure. We need to continue replace our oldest infrastructure but also begin to think of our infrastructure as an entire system in need of sustainable funding. We have to make collaborative and smart decisions, while assuring that safety remains our top priority.
We can continue to tackle Illinois’ infrastructure needs by asking our leaders to take on these 3 Key Solutions that would help and raise Illinois’s grades:
1. State and local governments should work together to create smart, efficient transportation systems that meet the changing needs of Illinois’s communities. We cannot just repair the investments of the past, but we need to build systems for a 21st century Illinois.
2. Create sustainable funding to maintain all new and planned investments in Illinois’s water systems. Simply replacing old pipes with limited or no plans for operation and maintenance will only lead to similar problems for future generations.
3. Invest in networks that will lessen the costs of doing business in Illinois, including inland waterways, rail, and airports. As the economy continues to expand, Illinois needs world-class infrastructure to compete with other states for new businesses and manufacturing.
Read the full 2014 Report Card for Illinois’ Infrastructure here.
The 2014 Report Card for Illinois’ Infrastructure was released today by the Illinois Sections of the American Society of Civil Engineers (ASCE) at the Illinois Statehouse.
A panel of professional civil engineers throughout the state graded each infrastructure category according to the following eight criteria: capacity, condition, funding, future need, operation and maintenance, public safety, resilience, and innovation. In 2010, the infrastructure grade for Illinois was a D+, reflecting delayed maintenance and underinvestment across most categories. In the 2014 Report Card for Illinois’ Infrastructure, the state’s infrastructure G.P.A. jumped to a C- showing the progress made with leadership and solid infrastructure programs.
Over the past four years since the 2010 Report Card for Illinois’ Infrastructure, leaders at the state level and in Illinois’ cities—large and small—have started to make some steps to rebuild their aging infrastructure. Programs such as CREATE have started unclogging rail and traffic bottlenecks and the Illinois Jobs Now! effort by the state provided $31B to start fixing Illinois’ biggest infrastructure problems. These efforts have paid off and both the Rail and Drinking Water grades have gone up since the last Report Card. Plans like Chicago’s commitment to replace and repair aging water pipes shows how “thinking big” can create even bigger results.
But while some of the grades have gone up, Illinois’ infrastructure isn’t a B student yet. Aging infrastructure and delayed maintenance have taken their toll. Illinois’s average bridge is 40 years old which is close to retirement age for a bridge, Chicago has been replacing water pipes put in when Ulysses Grant was President, and more and more people and goods spend time stuck in traffic on Illinois’ roads and rails.
Let’s Raise the Grades
Illinois’s infrastructure touches almost every aspect of citizens’ daily life—from your neighborhood roads, to your phone, to the community school, to the new south suburban airport. In 2014, we need to be visionary but realistic about our infrastructure. We need to continue replace our oldest infrastructure but also begin to think of our infrastructure as an entire system in need of sustainable funding. We have to make collaborative and smart decisions, while assuring that safety remains our top priority.
We can continue to tackle Illinois’ infrastructure needs by asking our leaders to take on these 3 Key Solutions that would help and raise Illinois’s grades:
1. State and local governments should work together to create smart, efficient transportation systems that meet the changing needs of Illinois’s communities. We cannot just repair the investments of the past, but we need to build systems for a 21st century Illinois.
2. Create sustainable funding to maintain all new and planned investments in Illinois’s water systems. Simply replacing old pipes with limited or no plans for operation and maintenance will only lead to similar problems for future generations.
3. Invest in networks that will lessen the costs of doing business in Illinois, including inland waterways, rail, and airports. As the economy continues to expand, Illinois needs world-class infrastructure to compete with other states for new businesses and manufacturing.
Read the full 2014 Report Card for Illinois’ Infrastructure here.
Tags: Illinois, infrastructure, report card, solutions, transit, transportation, vision, water
No Comments »
New Report Shows $1 Spent on Parks Means $10 for Local Economies
March 11th, 2014 | By: Infrastructure Report Card
 The National Park Service has released a new report showing the impact of parks on local economies.
Here a few of the top level findings of the report:
The National Park Service has released a new report showing the impact of parks on local economies.
Here a few of the top level findings of the report:
- In 2012, the nation’s 401 parks attracted more than 280 million visitors.
- National parks generated more than $26 billion in economic activity in 2012; visitors spend on hotels, convenience stores, outfitters and other businesses
- Secondary effects, like employees spending money at local businesses, brought in an additional $15.4 billion
- Every $1 from Congress results in $10 of economic activity
- Estimates now reach $11 billion for the nation’s parks maintenance backlog
- Of the 50 states, California’s parks brought in the most visitor spending – $1.5 billion
Tags: economic impact, parks
No Comments »
New Report Estimates $200B Needed to Fix America’s Schools
March 7th, 2014 | By: Infrastructure Report Card
 After more than a decade, this week the National Center for Education Statistics (NCES) released an update to the Condition of America’s Public School Facilities report highlighting the condition of America’s school facilities. This report echoed the school facilities findings of the 2013 Report Card for America’s Infrastructure and showed the estimated need to bring school facilities into good repair was almost $200 billion. The report also estimates that on average about $4.5 million will need to be spent per school needing repairs. While the needs are significant, the findings also highlighted some positive changes – 60% of the sampled schools reported to have long-range educational facilities plans and 39% of schools have major renovations and modernization work planned in the next two years. While the study represents only a sample of America’s schools, it is encouraging to see the U.S. Department of Education release this much needed data on America’s schools.
Read the new report here.
After more than a decade, this week the National Center for Education Statistics (NCES) released an update to the Condition of America’s Public School Facilities report highlighting the condition of America’s school facilities. This report echoed the school facilities findings of the 2013 Report Card for America’s Infrastructure and showed the estimated need to bring school facilities into good repair was almost $200 billion. The report also estimates that on average about $4.5 million will need to be spent per school needing repairs. While the needs are significant, the findings also highlighted some positive changes – 60% of the sampled schools reported to have long-range educational facilities plans and 39% of schools have major renovations and modernization work planned in the next two years. While the study represents only a sample of America’s schools, it is encouraging to see the U.S. Department of Education release this much needed data on America’s schools.
Read the new report here.
Tags: condition, infrastructure, school facilities, schools
1 Comment »
Success Story: Louisville’s Riverbank Filtration Projects are Innovating with Nature
February 12th, 2014 | By: Infrastructure Report Card
When change is needed, water utilities like the Louisville Water Company also look to see what else can be improved in the process. The Riverbank Filtration Tunnel and Pump Station project at the B.E. Payne Treatment Plant was developed in Louisville to exceed new regulations that took effect in 2012 by the Safe Drinking Water Act. This new video explains how this innovative project works to harness nature to better serve their community. The project includes combining a gravity tunnel with wells as a source for drinking water, making the Louisville Water Company the first water utility in the world to do so. The project uses the Riverbank Filtration process—a “green supply” purification method using natural filtering of a riverbank to remove contaminants. By using a natural filtration process, the project saves the state money and will result in fewer water main issues. To learn more about the project, visit the project profile or this article. If you’d like to know more about Kentucky’s infrastructure, get a great summary of the issues here in their Infrastructure Report Card.Tags: Kentucky, report card, success, sustainability, water
No Comments »
Georgia's C Infrastructure
January 13th, 2014 | By: Infrastructure Report Card
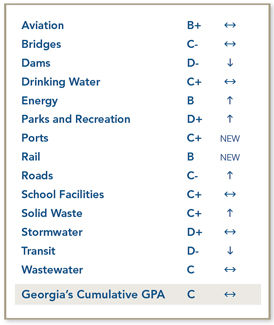
 Georgia’s infrastructure has failed to improve over the last five years. In a new report, titled the 2014 Report Card for Georgia’s Infrastructure, the Georgia Section of the American Society of Civil Engineers (ASCE) awarded the state’s infrastructure a “C,” a grade unchanged from their 2009 Report Card. The lowest grade awarded was a “D-”, which went to the state’s dams and transit systems. The Report Card’s highest grade, a “B,” was given to Georgia’s energy and rail systems. Georgia’s growing population combined with cutbacks in infrastructure funding resulted in many of the low grades.
Specifically, the Report Card finds that Georgia is lagging in sustainable investment, including:
Georgia’s infrastructure has failed to improve over the last five years. In a new report, titled the 2014 Report Card for Georgia’s Infrastructure, the Georgia Section of the American Society of Civil Engineers (ASCE) awarded the state’s infrastructure a “C,” a grade unchanged from their 2009 Report Card. The lowest grade awarded was a “D-”, which went to the state’s dams and transit systems. The Report Card’s highest grade, a “B,” was given to Georgia’s energy and rail systems. Georgia’s growing population combined with cutbacks in infrastructure funding resulted in many of the low grades.
Specifically, the Report Card finds that Georgia is lagging in sustainable investment, including:
- Georgia ranks 49th in the nation in per capita transportation funding.
- Georgia is among the lowest in the country in transit spending per resident. According to the American Public Transportation Association’s 2010 Survey of State Funding for Public Transportation, Georgia spent just $0.63 per person in 2008. In comparison, New Jersey spent $119.52, Illinois spent $40.43, and North Carolina spent $7.94 per person in the same year.
- Georgia’s Safe Dams Program has faced over a 50% cut in staff since 2003, with each safety official now expected to oversee over 1,000 dams, or five times the national average.
- MARTA is the largest transit agency in the country to not receive state funding support for operations
- Georgia’s state motor fuel excise tax—which funds surface transportation projects—is one of the lowest in the United States
Tags: dams, grades, infrastructure, report card, state, transit, transportation, water
1 Comment »
Georgia's Infrastructure Is On Our Mind
January 8th, 2014 | By: Infrastructure Report Card
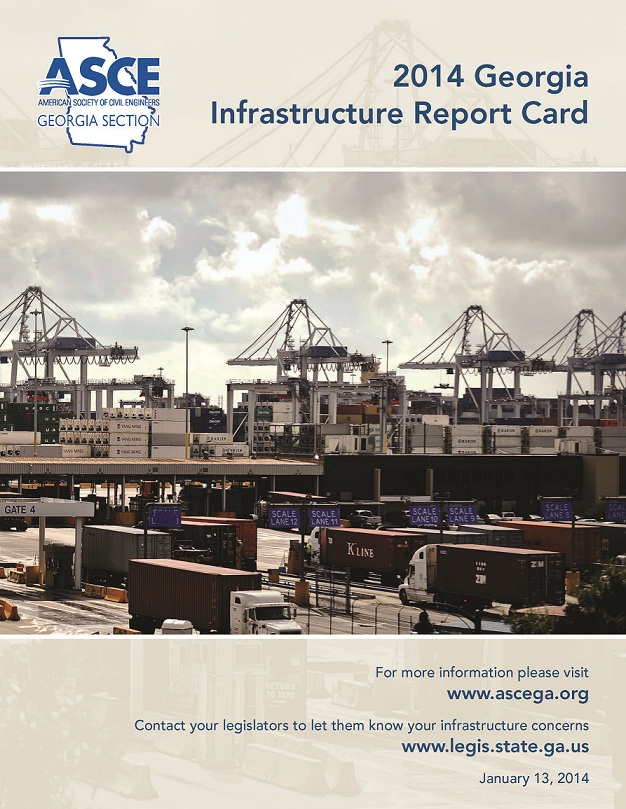 The 2014 Report Card for Georgia’s Infrastructure will be released next Monday, January 13th, in the South Wing of the State Capitol on the very first day day of Georgia’s legislative session. Highlighting the infrastructure needs across the state, the Report Card will provide a new GPA for Georgia’s infrastructure as well as new grades for specific areas — Aviation, Bridges, Dams, Drinking Water, Energy, Parks and Recreation, Ports (new), Rail (new), Roads, School Facilities, Solid Waste, Stormwater, Transit, and Wastewater.
Check back here on the 13th to find out what grades Georgia earned in the 2014 Report Card for Georgia’s Infrastructure! If you’re a supporter of Georgia’s infrastructure and in the Atlanta area, we invite you to join us for the Report Card release event:
WHAT: News conference for the release of the 2014 Report Card for Georgia’s Infrastructure
WHO: American Society of Civil Engineers, Georgia Section
Speakers: Georgia State Representative Ed Setzler
Kat Gurd, President of the Georgia Section of ASCE
Daniel Agramonte, Co-Chair of Report Card Committee
WHEN: Monday, January 13, 2014, 11:30 AM
WHERE: State Capitol South Wing
Georgia State Capitol Building
206 Washington St SW
Atlanta, Georgia 30334
WHY: Infrastructure has a direct impact on our lives every day—from the water we drink, to the schools our children attend and to the roads and rails we travel. Infrastructure is vital to our economy, security, recreation and safety. Will Georgia’s infrastructure systems make the grade?
The 2014 Report Card for Georgia’s Infrastructure will be released next Monday, January 13th, in the South Wing of the State Capitol on the very first day day of Georgia’s legislative session. Highlighting the infrastructure needs across the state, the Report Card will provide a new GPA for Georgia’s infrastructure as well as new grades for specific areas — Aviation, Bridges, Dams, Drinking Water, Energy, Parks and Recreation, Ports (new), Rail (new), Roads, School Facilities, Solid Waste, Stormwater, Transit, and Wastewater.
Check back here on the 13th to find out what grades Georgia earned in the 2014 Report Card for Georgia’s Infrastructure! If you’re a supporter of Georgia’s infrastructure and in the Atlanta area, we invite you to join us for the Report Card release event:
WHAT: News conference for the release of the 2014 Report Card for Georgia’s Infrastructure
WHO: American Society of Civil Engineers, Georgia Section
Speakers: Georgia State Representative Ed Setzler
Kat Gurd, President of the Georgia Section of ASCE
Daniel Agramonte, Co-Chair of Report Card Committee
WHEN: Monday, January 13, 2014, 11:30 AM
WHERE: State Capitol South Wing
Georgia State Capitol Building
206 Washington St SW
Atlanta, Georgia 30334
WHY: Infrastructure has a direct impact on our lives every day—from the water we drink, to the schools our children attend and to the roads and rails we travel. Infrastructure is vital to our economy, security, recreation and safety. Will Georgia’s infrastructure systems make the grade?
Tags: aviation, dams, Georgia, infrastructure, ports, roads, state, state report card, transit, water
No Comments »
Infrastructure Is the Missing Ingredient to Healthy School Lunches
December 30th, 2013 | By: Infrastructure Report Card
 The Kids’ Safe and Healthful Foods Project lead by The Pew Charitable Trusts and the Robert Wood Johnson Foundation released a report this December titled, Serving Healthy School Meals: U.S. Schools Need Updated Kitchen Equipment. They found that 55% of school food authorities (SFAs) need kitchen infrastructure changes at one or more schools to meet new healthy lunch requirements. That’s right – the majority of America’s schools need to fix their school’s infrastructure problems in order to serve up healthy school lunches every day.
Here’s a few of their key findings:
The Kids’ Safe and Healthful Foods Project lead by The Pew Charitable Trusts and the Robert Wood Johnson Foundation released a report this December titled, Serving Healthy School Meals: U.S. Schools Need Updated Kitchen Equipment. They found that 55% of school food authorities (SFAs) need kitchen infrastructure changes at one or more schools to meet new healthy lunch requirements. That’s right – the majority of America’s schools need to fix their school’s infrastructure problems in order to serve up healthy school lunches every day.
Here’s a few of their key findings:


Tags: infrastructure, infrastructure investment, report card, schools, state
No Comments »
Celebrating Infrastructure Successes in 2013
December 27th, 2013 | By: Infrastructure Report Card
Looking back over 2013, we have many successes in making infrastructure a priority to celebrate. Here are a few that really made our year: 1. The 2013 Report Card for America’s Infrastructure was launched in March as a tablet and smartphone app gaining more traction with the media and decision makers than ever before and was even mentioned by President Obama during a “Rebuilding America” event at the Port of Miami.
2. Stephen Colbert showcased the uptick in America’s Report Card grades as a “Tiny Triumph” on the Colbert Report in April taking the infrastructure message to a whole new audience.
3. The Water Resources Development Act which will greatly help our ports and inland waterways deal with their pressing needs is currently in the hands of a House and Senate conference committee, and we hope to see it enacted early in 2014 (stay tuned!). It’s not too late to tell your member of Congress that this should be on Congress’ 2014 to-do list. Email them right here with a few clicks.
4. Major infrastructure funding legislative initiatives took off in several states including Maryland, Massachusetts, Pennsylvania, Virginia, Vermont, Wyoming, Texas, and Maine.
5. Several new bills were introduced that would start improving the nation’s infrastructure: The Partnership to Build America Act (H.R. 2084), which could re-shape the way infrastructure in the United States is financed; the UPDATE Act (H.R. 3636), which would increase investment in transportation infrastructure through an increase in the federal gas tax/user fee; the BRIDGE Act (S. 1716)/National Infrastructure Development Bank Act (H.R. 2553), both of which would facilitate infrastructure investment through creation of a national infrastructure bank.
1. The 2013 Report Card for America’s Infrastructure was launched in March as a tablet and smartphone app gaining more traction with the media and decision makers than ever before and was even mentioned by President Obama during a “Rebuilding America” event at the Port of Miami.
2. Stephen Colbert showcased the uptick in America’s Report Card grades as a “Tiny Triumph” on the Colbert Report in April taking the infrastructure message to a whole new audience.
3. The Water Resources Development Act which will greatly help our ports and inland waterways deal with their pressing needs is currently in the hands of a House and Senate conference committee, and we hope to see it enacted early in 2014 (stay tuned!). It’s not too late to tell your member of Congress that this should be on Congress’ 2014 to-do list. Email them right here with a few clicks.
4. Major infrastructure funding legislative initiatives took off in several states including Maryland, Massachusetts, Pennsylvania, Virginia, Vermont, Wyoming, Texas, and Maine.
5. Several new bills were introduced that would start improving the nation’s infrastructure: The Partnership to Build America Act (H.R. 2084), which could re-shape the way infrastructure in the United States is financed; the UPDATE Act (H.R. 3636), which would increase investment in transportation infrastructure through an increase in the federal gas tax/user fee; the BRIDGE Act (S. 1716)/National Infrastructure Development Bank Act (H.R. 2553), both of which would facilitate infrastructure investment through creation of a national infrastructure bank.
 6. Five states – North Carolina, Oklahoma, Kansas, Missouri, and Washington – put out state-based Infrastructure Report Cards challenging their state’s leaders to get to work on the infrastructure issues in their area.
Thanks for your support in making these happen and we look forward to making 2014 an even bigger year for infrastructure!
6. Five states – North Carolina, Oklahoma, Kansas, Missouri, and Washington – put out state-based Infrastructure Report Cards challenging their state’s leaders to get to work on the infrastructure issues in their area.
Thanks for your support in making these happen and we look forward to making 2014 an even bigger year for infrastructure!
Tags: app, media, report card, state, state report cards, transportation, water
No Comments »
Meet IP3, the New P3 Where Citizens Are the Owners
December 19th, 2013 | By: Infrastructure Report Card
 If you follow the infrastructure financing debate about how America is going to fund our future infrastructure needs, you have probably heard the term P3 or public-private partnership discussed as an innovative financing structure to utilize private investment in public infrastructure. However, with the release of the American Enterprise Institute’s new report, Road Pricing and Asset Publicization,” there is a new angle for the debate – the investment public-private partnership (IP3).
So what exactly is this IP3? Here’s how the report’s authors explain it: “The IP3 recognizes that you not the federal government or a private company—own roads that have already been built. And it offers you an annual payment for investing in them…. Under an IP3, a private company pays a public partner (like a state) a large upfront cash payment (called a concession) for the right to operate and collect toll revenue from an existing road network for a certain period of time. The IP3 locks away most of that concession payment—and most of the toll revenue—in a protected investment fund that pays an annual dividend to all households in the newly priced region. That helps offset the additional costs they will face from tolls, while recognizing that citizens are the true owners of the roads.”
America’s roads are definitely in need of repair so the more new ideas that are debated that’s all the better including P3s, gas tax changes and fixes, and all the others. While P3s are only one potential solution among the many, one thing is for certain – it’s time to start debating before the Highway Trust Fund is broke and many states lose half of their highway and bridge funding.
If you follow the infrastructure financing debate about how America is going to fund our future infrastructure needs, you have probably heard the term P3 or public-private partnership discussed as an innovative financing structure to utilize private investment in public infrastructure. However, with the release of the American Enterprise Institute’s new report, Road Pricing and Asset Publicization,” there is a new angle for the debate – the investment public-private partnership (IP3).
So what exactly is this IP3? Here’s how the report’s authors explain it: “The IP3 recognizes that you not the federal government or a private company—own roads that have already been built. And it offers you an annual payment for investing in them…. Under an IP3, a private company pays a public partner (like a state) a large upfront cash payment (called a concession) for the right to operate and collect toll revenue from an existing road network for a certain period of time. The IP3 locks away most of that concession payment—and most of the toll revenue—in a protected investment fund that pays an annual dividend to all households in the newly priced region. That helps offset the additional costs they will face from tolls, while recognizing that citizens are the true owners of the roads.”
America’s roads are definitely in need of repair so the more new ideas that are debated that’s all the better including P3s, gas tax changes and fixes, and all the others. While P3s are only one potential solution among the many, one thing is for certain – it’s time to start debating before the Highway Trust Fund is broke and many states lose half of their highway and bridge funding.
Tags: bridges, infrastructure, infrastructure report card, P3, roads, surface transportation, transportation
1 Comment »