Author Archive
8 Things Worth Knowing About Montana’s C- Infrastructure
November 19th, 2014 | By: Infrastructure Report Card

Corroded Cast Iron Water Pipe, 75-100 Years Old, Cascade, MT
Source: Great West Engineering, Inc.
Tags: dams, infrastructure, Montana, pipes, report card, schools, water
No Comments »
Infrastructure in Arkansas Earns D+
October 17th, 2014 | By: Infrastructure Report Card
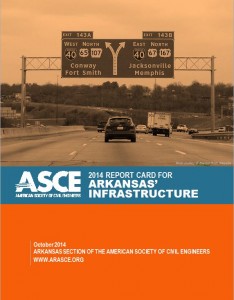 This Thursday, the Arkansas Section of the American Society of Civil Engineers released their inaugural Infrastructure Report Card for the state grading the states’ infrastructure.
Arkansas’ infrastructure received a cumulative GPA of “D+” in the 2014 Report Card for Arkansas’ Infrastructure. The seven infrastructure categories evaluated in the report include:
Roads (D+)
Drinking water (D+)
Transit (D+)
Levees (D)
Dams (D)
Bridges (C+)
Wastewater (C+)
The report noted that Arkansas has the 12th largest highway system in the nation, as well as the second highest traffic fatality rate in the country as of 2010. In addition, the state has 214 wastewater treatment facilities that will need upgrades and improvements in the next 20 years.
The Report Card, the first for Arkansas, was released during the annual ASCE Arkansas Section Conference and included a keynote address by Scott Bennett, director of the Arkansas State Highway and Transportation Department. The report was featured in both the Arkansas Democrat-Gazette and the Times-Record. The effort was led by Aaron Robinson, P.E., based in Jacksonville, Arkansas.
Read the full Arkansas Report Card
This Thursday, the Arkansas Section of the American Society of Civil Engineers released their inaugural Infrastructure Report Card for the state grading the states’ infrastructure.
Arkansas’ infrastructure received a cumulative GPA of “D+” in the 2014 Report Card for Arkansas’ Infrastructure. The seven infrastructure categories evaluated in the report include:
Roads (D+)
Drinking water (D+)
Transit (D+)
Levees (D)
Dams (D)
Bridges (C+)
Wastewater (C+)
The report noted that Arkansas has the 12th largest highway system in the nation, as well as the second highest traffic fatality rate in the country as of 2010. In addition, the state has 214 wastewater treatment facilities that will need upgrades and improvements in the next 20 years.
The Report Card, the first for Arkansas, was released during the annual ASCE Arkansas Section Conference and included a keynote address by Scott Bennett, director of the Arkansas State Highway and Transportation Department. The report was featured in both the Arkansas Democrat-Gazette and the Times-Record. The effort was led by Aaron Robinson, P.E., based in Jacksonville, Arkansas.
Read the full Arkansas Report Card
Tags: Arkansas, bridges, dams, infrastructure, levees, report, report card, roads, transit, wastewater, water
No Comments »
Vermont Infrastructure Shows Improvement in New Report Card
October 17th, 2014 | By: Infrastructure Report Card
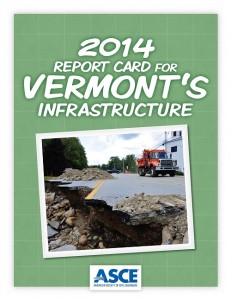 The latest Report Card for Vermont’s Infrastructure showed a slight improvement in their overall GPA to a “C.” The 2014 Report Card for Vermont’s Infrastructure is an update from 2011, when the state received a “C-” cumulative grade. The Report Card assessed bridges (C), dams (C), drinking water (C-), wastewater (D), roads (C-), and solid waste (C+).
After Tropical Storm Irene damaged the state’s infrastructure backbone in 2011, Vermont made significant investments through catch-up and emergency funding. In addition, the state’s most recent transportation funding package provided close to $700 million for transportation infrastructure, the largest transportation infrastructure investment in state history. There have also been programmatic changes. Road fatalities have been cut nearly in half since 2006 due to changes made using the Strategic Highway Safety Plan.
Led by Amanda Hanaway-Corrente, P.E. who chaired the effort and Vermont Section President-Elect Jessica Clark Louisos, P.E., the Report Card was released at a luncheon in Montpelier, which included a keynote from Sue Minter, deputy secretary at the Vermont Agency of Transportation (VTRANS) and David Mears, commissioner of the Department of Environmental Conservation.
“Vermont is poised to grow our economy as we continue to make investments into our infrastructure. The transportation funding that was signed into law in June is one example of how the state continues to focus on innovation and jobs,” said Minter.
Media coverage of the event included the Burlington Free Press and WCAX.
Read the full Vermont Report Card
The latest Report Card for Vermont’s Infrastructure showed a slight improvement in their overall GPA to a “C.” The 2014 Report Card for Vermont’s Infrastructure is an update from 2011, when the state received a “C-” cumulative grade. The Report Card assessed bridges (C), dams (C), drinking water (C-), wastewater (D), roads (C-), and solid waste (C+).
After Tropical Storm Irene damaged the state’s infrastructure backbone in 2011, Vermont made significant investments through catch-up and emergency funding. In addition, the state’s most recent transportation funding package provided close to $700 million for transportation infrastructure, the largest transportation infrastructure investment in state history. There have also been programmatic changes. Road fatalities have been cut nearly in half since 2006 due to changes made using the Strategic Highway Safety Plan.
Led by Amanda Hanaway-Corrente, P.E. who chaired the effort and Vermont Section President-Elect Jessica Clark Louisos, P.E., the Report Card was released at a luncheon in Montpelier, which included a keynote from Sue Minter, deputy secretary at the Vermont Agency of Transportation (VTRANS) and David Mears, commissioner of the Department of Environmental Conservation.
“Vermont is poised to grow our economy as we continue to make investments into our infrastructure. The transportation funding that was signed into law in June is one example of how the state continues to focus on innovation and jobs,” said Minter.
Media coverage of the event included the Burlington Free Press and WCAX.
Read the full Vermont Report Card


Tags: bridges, dams, grade, infrastructure, report card, roads, transportation, Vermont, wastewater, water
No Comments »
Arkansas and Vermont to Release Infrastructure Report Cards
October 12th, 2014 | By: Infrastructure Report Card
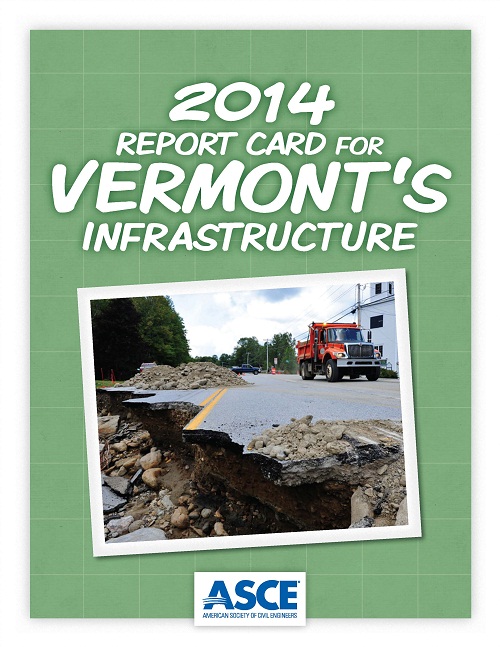 The Vermont Section of the American Society of Civil Engineers (ASCE) will release the 2014 Report Card for Vermont’s Infrastructure on Thursday, October 16th in Montpelier. The report will review the impact of Tropical Storm Irene on Vermont’s bridges, dams, drinking water, wastewater, roads and solid waste and assess the current condition today. Report Card Committee Chair Amanda Hanaway-Corrente, PE, MBA, will present the new Report Card grades and findings, and the keynote speaker, Sue Minter, the Deputy Secretary of the Vermont Agency of Transportation will highlight Vermont’s progress in rebuilding stronger after the storm. RSVP here to attend the event.
 The Arkansas Section of the American Society of Civil Engineers (ASCE) will release the 2014 Report Card for Arkansas’ Infrastructure next Thursday during the ASCE Arkansas Annual Conference in Little Rock. The report includes an evaluation of Arkansas’ roads, bridges, transit, drinking water, wastewater, levees, and dams. A presentation the Report Card findings will be presented by Aaron Robinson, PE PS M.ASCE, and a keynote will be delivered the Arkansas State Highway and Transportation Department Director, Scott Bennett. Attend the conference and release event.
Humboldt County California's Transportation Report Card Released
September 8th, 2014 | By: Infrastructure Report Card
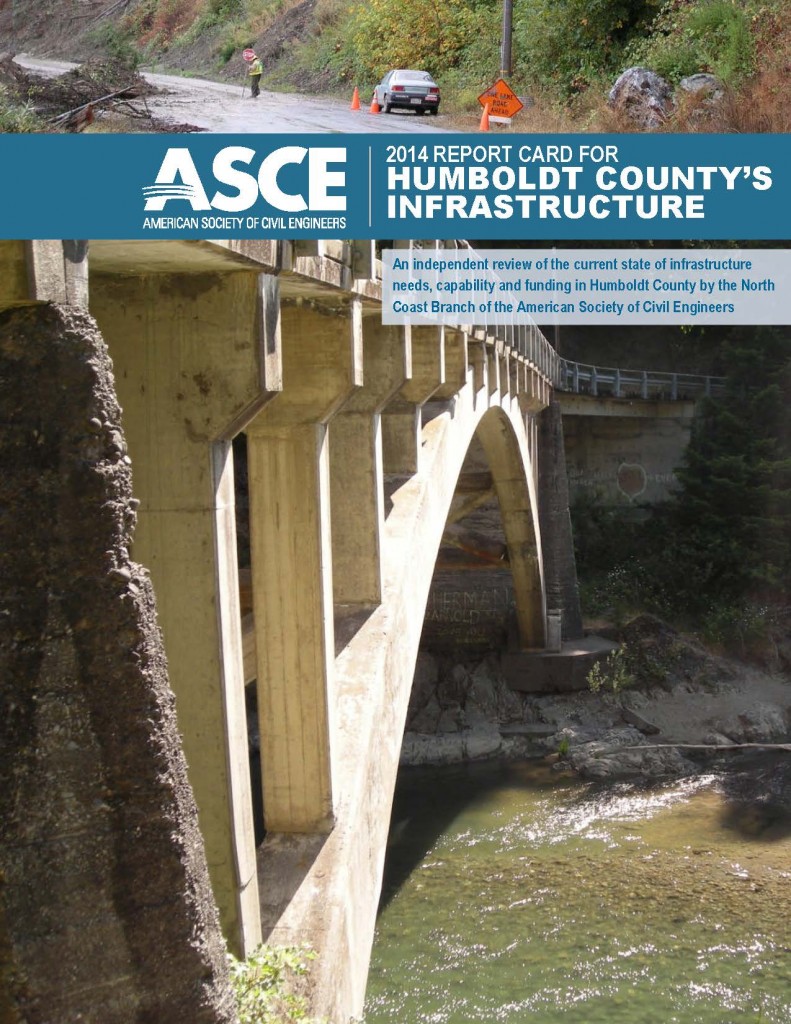 This afternoon the 2014 Report Card for Humboldt County’s Infrastructure, an independent review of the area’s transportation needs, was released by the North Coast Branch of the American Society of Civil Engineers. The Report Card gave the County’s roads a grade of D+ grade and bridges received a grade of C-.
According to the new report, Humboldt County’s locally owned roads and bridges need five times the current investment simply to maintain their current condition.
“The grades are disappointing, but not surprising to Humboldt County’s citizens who drive these roads and bridges,” said Yoash Tilles, president, ASCE North Coast Branch. “This impacts our community’s economy, safety and daily life. It is time to make the investment to improve our transportation infrastructure.”
Among the key findings of the report:
This afternoon the 2014 Report Card for Humboldt County’s Infrastructure, an independent review of the area’s transportation needs, was released by the North Coast Branch of the American Society of Civil Engineers. The Report Card gave the County’s roads a grade of D+ grade and bridges received a grade of C-.
According to the new report, Humboldt County’s locally owned roads and bridges need five times the current investment simply to maintain their current condition.
“The grades are disappointing, but not surprising to Humboldt County’s citizens who drive these roads and bridges,” said Yoash Tilles, president, ASCE North Coast Branch. “This impacts our community’s economy, safety and daily life. It is time to make the investment to improve our transportation infrastructure.”
Among the key findings of the report:
- The Tribes, Cities and the County need five times its current funding to maintain the locally-operated roads and bridges at their current condition.
- In Humboldt County, the average condition of roads is assessed as mediocre.
- The locally-owned 170 bridges within Humboldt County received the average rating of mediocre.
- The number of lives lost in car accidents in Humboldt County is approximately double the state rate according to the California Highway Safety Plan for 2014.
- To improve roads and bridges, $426 million must be invested over the next 10 years.
Tags: bridges, California, Eureka, Humboldt County, infrastructure, roads, transportation
No Comments »
Harnessing the Natural Process for Clean Water in Colorado
August 20th, 2014 | By: Infrastructure Report Card
 Let’s Envision the Infrastructure for Tomorrow
America’s infrastructure needs a national commitment to bring existing infrastructure into a state-of-good-repair, and in the long term we must modernize and build in a targeted and strategic manner. This means leadership at the federal, state, and local levels of government, by businesses and individuals, to communicate the importance of our nation’s infrastructure, to craft innovative solutions that reflect the diverse needs of the nation, and to make the investments the system needs. By employing strategies to use every dollar more efficiently and by deploying creative solutions to infrastructure development such as public–private partnerships, we can implement the right projects on time at the right price. Below is a brief success story that shows how we can do this effectively.
Water Success Story: Harnessing the Natural Process for Clean Water
Let’s Envision the Infrastructure for Tomorrow
America’s infrastructure needs a national commitment to bring existing infrastructure into a state-of-good-repair, and in the long term we must modernize and build in a targeted and strategic manner. This means leadership at the federal, state, and local levels of government, by businesses and individuals, to communicate the importance of our nation’s infrastructure, to craft innovative solutions that reflect the diverse needs of the nation, and to make the investments the system needs. By employing strategies to use every dollar more efficiently and by deploying creative solutions to infrastructure development such as public–private partnerships, we can implement the right projects on time at the right price. Below is a brief success story that shows how we can do this effectively.
Water Success Story: Harnessing the Natural Process for Clean Water
Tags: Colorado, drought, energy, infrastructure, Prairie Waters Projec, purification, water
No Comments »
How Your State Funds School Construction
July 24th, 2014 | By: Infrastructure Report Card
 In every community across the U.S. is a school building. They’re used for learning, libraries, sports, and feeding kids, but they’re also used for community meetings, school programs, and in emergencies. Each one of these schools is different, and so it’s probably not a surprise that they’re all funded differently. The Pennsylvania Department of Education recently put together a summary of how all the states fund their capital planning projects like new buildings and modernizations in their Planning and Construction Workbook: A Report to the General Assembly. Here is what they found:
Alabama: The Alabama Department of Education provides annual grants to school districts.
Alaska: The Alaska Department of Education and Early Development provides debt reimbursement and grant funding for individual projects.
Arizona: The Arizona School Facilities Board, through use of the Building Renewal Fund, provides project level grants on a competitive basis for capital improvements to existing facilities. The state also provides formula driven grants for new construction.
Arkansas: The Arkansas Division of Public School Academic Facilities and Transportation provides funds directly to local school districts for qualifying new construction, renovation, or alteration projects.
California: The state distributes facility funding directly to the local school districts through matching grants and reimbursements for individual projects. Generally, funds are distributed on a first come, first served basis, based on eligibility for funding, as determined by projected unhoused students for new construction and age of facilities for modernization.
Colorado: The Colorado Department of Education provides matching grants to local school districts on a competitive basis through the BEST program. The state’s minimum match is determined using several measures of school district wealth in comparison with statewide averages, as well as bond election effort and success over the past decade.
Connecticut: The Connecticut Department of Education provides matching grants to local school districts, with the state share (between 20 and 80 percent) determined by relative district wealth ranking.
Delaware: The Delaware Department of Education provides funding to local school districts for specific projects. The share of state support for public school facilities ranges from 60 to 80 percent and is determined by using an ability construction ratio that looks at the relative property wealth of a school district.
D.C.: The District of Columbia provides the Office of Public Educational Facility Modernization (OPEFM) capital funds for building improvements to the schools within the District of Columbia’s Public School system.
Florida: The Florida Department of Education provides monthly disbursements to local school districts based on available revenues, which are allocated by statutory formulas. (In January of 2012, Florida temporarily halted funding for all school construction projects due to lack of available resources. As a result of this decision, funding for projects was discontinued and schools and colleges were asked to return $250 million to the state until a solution could be identified and agreed upon.)
Georgia: The Georgia Department of Education provides reimbursements to school districts for approved facility projects, with the state facility funding level set by formula in state law.
Hawaii: The Hawaii Department of Education pays directly for local facility projects. Prioritization and state funding allocation is determined based on school building age and condition, as well as student demographics, building health and safety and maintenance needs.
Idaho: The Idaho Department of Education provides local school districts with facility assistance in the form of bond repayment subsidies, allocations for maintenance and emergency funds.
Illinois: The state provides grants to local schools districts for approved projects, with an automatic set‐aside of 20 percent of available state school construction funds allocated to Chicago Public Schools. The level of state funding depends upon district wealth and project type.
Indiana: Indiana provides no funds for school district capital outlay.
Iowa: The Iowa Department of Education provides grants to local school districts using a per pupil allocation formula. An equalization formula is used to distribute aid, with lower wealth school districts getting a higher share of state facility support.
Kansas: The Kansas Department of Education provides funding to local school districts for individual approved projects through three funding streams: bond and interest aid, capital outlay aid and new facilities weighting.
Kentucky: The Kentucky School Facilities Construction Commission provides annual appropriations to local school districts for facility funding through three primary funding sources.
Louisiana: Louisiana provides no funding for school capital outlay projects.
Maine: The Maine Department of Education provides reimbursements to local school districts for capital projects, with funding determinations made based on building condition.
Maryland: Maryland provides direct payments to vendors and reimbursements to local school districts.
Massachusetts: The Massachusetts School Building Authority provides matching reimbursement funds to cities, towns and regional school districts for individual projects. Project funding is determined based on building condition and overcrowding, with funds going to the neediest projects first. The state aid matching percentage varies depending on district wealth, with up to 80 percent of project costs covered for low‐wealth districts.
Michigan: Michigan provides school districts with loans (which must be repaid) to assist in making debt service payment on their qualified bonds.
Minnesota: The Minnesota Department of Education provides facility funding to local school districts through three primary mechanisms: Operating Capital Revenue as a component of the general education funding formula, Debt Service Equalization Aid and Maximum Effort School Aid loans.
Mississippi: The Mississippi Department of Education provides funds to local school districts for approved projects with the amount determined by project type and square footage.
Missouri: Missouri provides no funding to local school districts for capital projects.
Montana: The Montana Office of Public Instruction pays local school districts’ debt service, with state funding dependent on district wealth.
Nebraska: Nebraska provides no financial support to local school districts for capital outlay.
Nevada: Nevada provides no funding to school districts or public charter schools for capital outlay.
New Hampshire: New Hampshire provides reimbursements to school districts for approved capital projects. State funds are allocated based on community wealth equalization and the number of towns that utilize the school.
New Jersey: The New Jersey Department of Education provides project‐level funding to Regular Operating Districts, while Abbott districts are managed by the state with funds paid directly to contractors.
New Mexico: The New Mexico Public School Facilities Authority provides matching grants to local school districts for capital outlay as determined based on state‐established facility adequacy standards. The amount of the state match is based on district wealth.
New York: The New York Department of Education provides school districts with reimbursements for specific projects with state funds allocated based on district wealth and need.
North Carolina: The North Carolina Department of Public Infrastructure provides annual grants to school districts based on average daily membership and tax rate (higher tax rate qualifies for more state funds).
North Dakota: North Dakota provides no regular funding for capital outlay, although recently there have been one‐time appropriations of grant funds to local school districts for capital improvements.
Ohio: The Ohio School Facilities Commission provides matching grants to local school districts based on a legislative formula and rank of the district on the equity list.
Oklahoma: Oklahoma provides no funding to school districts for capital outlay.
Oregon: The Oregon Department of Education provides no funding to local school districts for capital outlay. However, the State Department of Energy has in the past provided $10 million annually for school energy conservation.
Pennsylvania: The Pennsylvania Department of Education provides reimbursements to local school districts for approved school construction projects.
Rhoda Island: The Rhode Island Department of Elementary and Secondary Education provide annual reimbursements to local school districts for approved capital projects. State facility funds are distributed first come, first served, based on need as determined by a community wealth index.
South Carolina: The South Carolina Department of Education provides reimbursements to school districts for approved capital projects, with funding levels determined by a formula that considers need and economy of the school district.
South Dakota: South Dakota provides no funding to local school districts for capital outlay.
Tennessee: Tennessee provides annual capital funds to local school districts through a formula as part of the Basic Education Program (BEP) funds.
Texas: The Texas Education Agency provides debt assistance to local school districts for capital projects through the Existing Debt Allotment (EDA) and Instructional Facilities Allotment (IFA) programs. State funds are allocated by statutory formula, with funding determinations made based on district wealth.
Utah: Utah provides annual non‐matching grants to local school districts based on formula.
Vermont: Vermont provides reimbursements to local school districts for approved projects. State reimbursement levels depend on project type.
Virginia: Virginia provides no grants to counties and cities for their public school capital projects. However, the state does permit the local municipalities to use the state’s credit rating and it provides some school construction funds at subsidized interest rates to school districts that meet program criteria.
Washington: Washington provides reimbursements to local school districts for approved projects. The level of state funding is determined by building condition and need for new space, with a funding formula based on maximum construction cost allocation.
West Virginia: The state provides reimbursements directly to individual approved capital projects. The School Building Authority evaluates projects for funding using established criteria that includes health and safety, reasonable travel time, regional planning, adequate space for projected enrollment, history of efforts to pass local bond issues, regularly scheduled preventative maintenance, and efficient use of funds.
Wisconsin: The state provides no facilities funding to local school districts.
Wyoming: The Wyoming School Facilities Commission (SFC) provides non‐matching grants to local school districts for approved capital projects. Project funding is determined by combining scores from a facility condition assessment, educational functionality, and capacity to create a prioritized needs index that identifies the most critical projects across the state. The SFC pays the full cost of all projects it funds – no local match is required.
In every community across the U.S. is a school building. They’re used for learning, libraries, sports, and feeding kids, but they’re also used for community meetings, school programs, and in emergencies. Each one of these schools is different, and so it’s probably not a surprise that they’re all funded differently. The Pennsylvania Department of Education recently put together a summary of how all the states fund their capital planning projects like new buildings and modernizations in their Planning and Construction Workbook: A Report to the General Assembly. Here is what they found:
Alabama: The Alabama Department of Education provides annual grants to school districts.
Alaska: The Alaska Department of Education and Early Development provides debt reimbursement and grant funding for individual projects.
Arizona: The Arizona School Facilities Board, through use of the Building Renewal Fund, provides project level grants on a competitive basis for capital improvements to existing facilities. The state also provides formula driven grants for new construction.
Arkansas: The Arkansas Division of Public School Academic Facilities and Transportation provides funds directly to local school districts for qualifying new construction, renovation, or alteration projects.
California: The state distributes facility funding directly to the local school districts through matching grants and reimbursements for individual projects. Generally, funds are distributed on a first come, first served basis, based on eligibility for funding, as determined by projected unhoused students for new construction and age of facilities for modernization.
Colorado: The Colorado Department of Education provides matching grants to local school districts on a competitive basis through the BEST program. The state’s minimum match is determined using several measures of school district wealth in comparison with statewide averages, as well as bond election effort and success over the past decade.
Connecticut: The Connecticut Department of Education provides matching grants to local school districts, with the state share (between 20 and 80 percent) determined by relative district wealth ranking.
Delaware: The Delaware Department of Education provides funding to local school districts for specific projects. The share of state support for public school facilities ranges from 60 to 80 percent and is determined by using an ability construction ratio that looks at the relative property wealth of a school district.
D.C.: The District of Columbia provides the Office of Public Educational Facility Modernization (OPEFM) capital funds for building improvements to the schools within the District of Columbia’s Public School system.
Florida: The Florida Department of Education provides monthly disbursements to local school districts based on available revenues, which are allocated by statutory formulas. (In January of 2012, Florida temporarily halted funding for all school construction projects due to lack of available resources. As a result of this decision, funding for projects was discontinued and schools and colleges were asked to return $250 million to the state until a solution could be identified and agreed upon.)
Georgia: The Georgia Department of Education provides reimbursements to school districts for approved facility projects, with the state facility funding level set by formula in state law.
Hawaii: The Hawaii Department of Education pays directly for local facility projects. Prioritization and state funding allocation is determined based on school building age and condition, as well as student demographics, building health and safety and maintenance needs.
Idaho: The Idaho Department of Education provides local school districts with facility assistance in the form of bond repayment subsidies, allocations for maintenance and emergency funds.
Illinois: The state provides grants to local schools districts for approved projects, with an automatic set‐aside of 20 percent of available state school construction funds allocated to Chicago Public Schools. The level of state funding depends upon district wealth and project type.
Indiana: Indiana provides no funds for school district capital outlay.
Iowa: The Iowa Department of Education provides grants to local school districts using a per pupil allocation formula. An equalization formula is used to distribute aid, with lower wealth school districts getting a higher share of state facility support.
Kansas: The Kansas Department of Education provides funding to local school districts for individual approved projects through three funding streams: bond and interest aid, capital outlay aid and new facilities weighting.
Kentucky: The Kentucky School Facilities Construction Commission provides annual appropriations to local school districts for facility funding through three primary funding sources.
Louisiana: Louisiana provides no funding for school capital outlay projects.
Maine: The Maine Department of Education provides reimbursements to local school districts for capital projects, with funding determinations made based on building condition.
Maryland: Maryland provides direct payments to vendors and reimbursements to local school districts.
Massachusetts: The Massachusetts School Building Authority provides matching reimbursement funds to cities, towns and regional school districts for individual projects. Project funding is determined based on building condition and overcrowding, with funds going to the neediest projects first. The state aid matching percentage varies depending on district wealth, with up to 80 percent of project costs covered for low‐wealth districts.
Michigan: Michigan provides school districts with loans (which must be repaid) to assist in making debt service payment on their qualified bonds.
Minnesota: The Minnesota Department of Education provides facility funding to local school districts through three primary mechanisms: Operating Capital Revenue as a component of the general education funding formula, Debt Service Equalization Aid and Maximum Effort School Aid loans.
Mississippi: The Mississippi Department of Education provides funds to local school districts for approved projects with the amount determined by project type and square footage.
Missouri: Missouri provides no funding to local school districts for capital projects.
Montana: The Montana Office of Public Instruction pays local school districts’ debt service, with state funding dependent on district wealth.
Nebraska: Nebraska provides no financial support to local school districts for capital outlay.
Nevada: Nevada provides no funding to school districts or public charter schools for capital outlay.
New Hampshire: New Hampshire provides reimbursements to school districts for approved capital projects. State funds are allocated based on community wealth equalization and the number of towns that utilize the school.
New Jersey: The New Jersey Department of Education provides project‐level funding to Regular Operating Districts, while Abbott districts are managed by the state with funds paid directly to contractors.
New Mexico: The New Mexico Public School Facilities Authority provides matching grants to local school districts for capital outlay as determined based on state‐established facility adequacy standards. The amount of the state match is based on district wealth.
New York: The New York Department of Education provides school districts with reimbursements for specific projects with state funds allocated based on district wealth and need.
North Carolina: The North Carolina Department of Public Infrastructure provides annual grants to school districts based on average daily membership and tax rate (higher tax rate qualifies for more state funds).
North Dakota: North Dakota provides no regular funding for capital outlay, although recently there have been one‐time appropriations of grant funds to local school districts for capital improvements.
Ohio: The Ohio School Facilities Commission provides matching grants to local school districts based on a legislative formula and rank of the district on the equity list.
Oklahoma: Oklahoma provides no funding to school districts for capital outlay.
Oregon: The Oregon Department of Education provides no funding to local school districts for capital outlay. However, the State Department of Energy has in the past provided $10 million annually for school energy conservation.
Pennsylvania: The Pennsylvania Department of Education provides reimbursements to local school districts for approved school construction projects.
Rhoda Island: The Rhode Island Department of Elementary and Secondary Education provide annual reimbursements to local school districts for approved capital projects. State facility funds are distributed first come, first served, based on need as determined by a community wealth index.
South Carolina: The South Carolina Department of Education provides reimbursements to school districts for approved capital projects, with funding levels determined by a formula that considers need and economy of the school district.
South Dakota: South Dakota provides no funding to local school districts for capital outlay.
Tennessee: Tennessee provides annual capital funds to local school districts through a formula as part of the Basic Education Program (BEP) funds.
Texas: The Texas Education Agency provides debt assistance to local school districts for capital projects through the Existing Debt Allotment (EDA) and Instructional Facilities Allotment (IFA) programs. State funds are allocated by statutory formula, with funding determinations made based on district wealth.
Utah: Utah provides annual non‐matching grants to local school districts based on formula.
Vermont: Vermont provides reimbursements to local school districts for approved projects. State reimbursement levels depend on project type.
Virginia: Virginia provides no grants to counties and cities for their public school capital projects. However, the state does permit the local municipalities to use the state’s credit rating and it provides some school construction funds at subsidized interest rates to school districts that meet program criteria.
Washington: Washington provides reimbursements to local school districts for approved projects. The level of state funding is determined by building condition and need for new space, with a funding formula based on maximum construction cost allocation.
West Virginia: The state provides reimbursements directly to individual approved capital projects. The School Building Authority evaluates projects for funding using established criteria that includes health and safety, reasonable travel time, regional planning, adequate space for projected enrollment, history of efforts to pass local bond issues, regularly scheduled preventative maintenance, and efficient use of funds.
Wisconsin: The state provides no facilities funding to local school districts.
Wyoming: The Wyoming School Facilities Commission (SFC) provides non‐matching grants to local school districts for approved capital projects. Project funding is determined by combining scores from a facility condition assessment, educational functionality, and capacity to create a prioritized needs index that identifies the most critical projects across the state. The SFC pays the full cost of all projects it funds – no local match is required.
Tags: capital, Funding, school, school facilities, state
No Comments »
5 Graphics Every Pennsylvania Driver Should See
July 17th, 2014 | By: Infrastructure Report Card
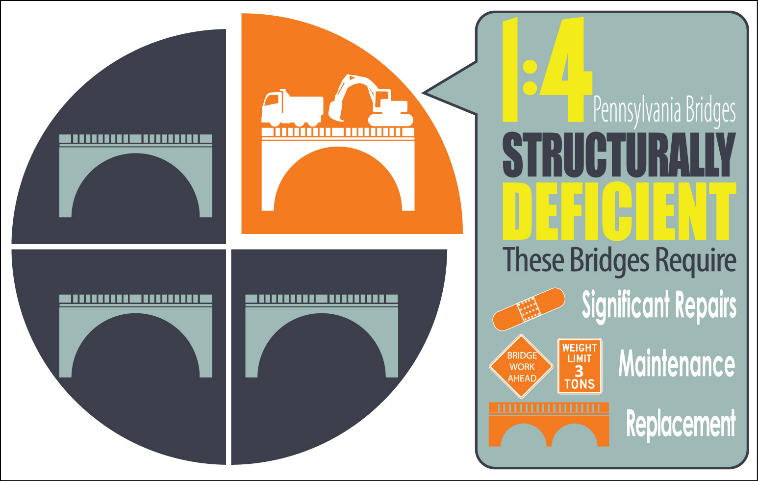
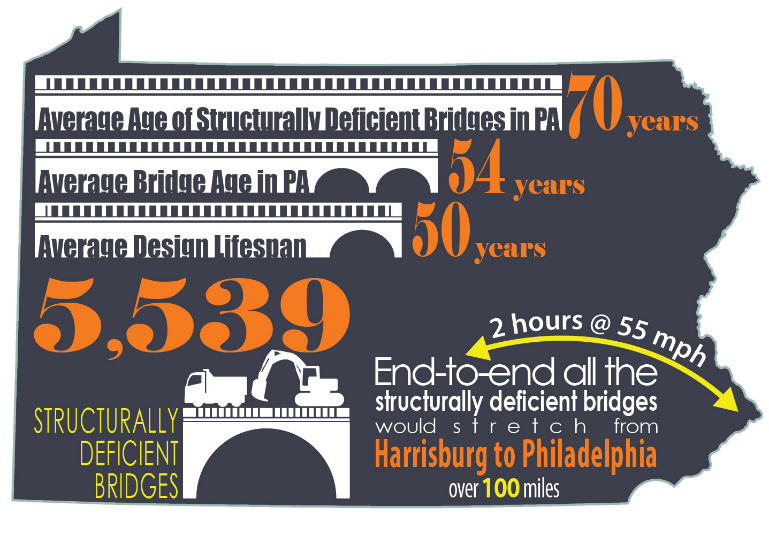
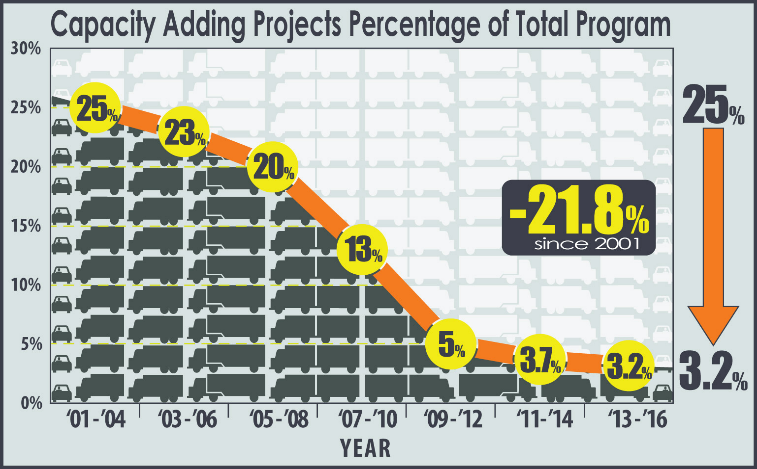
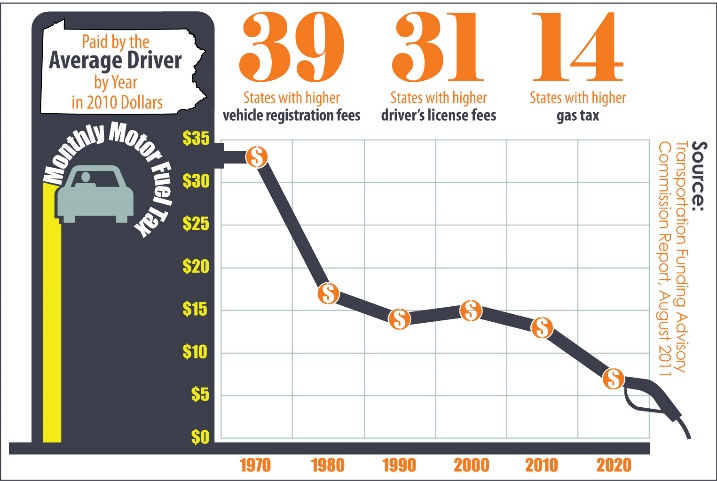
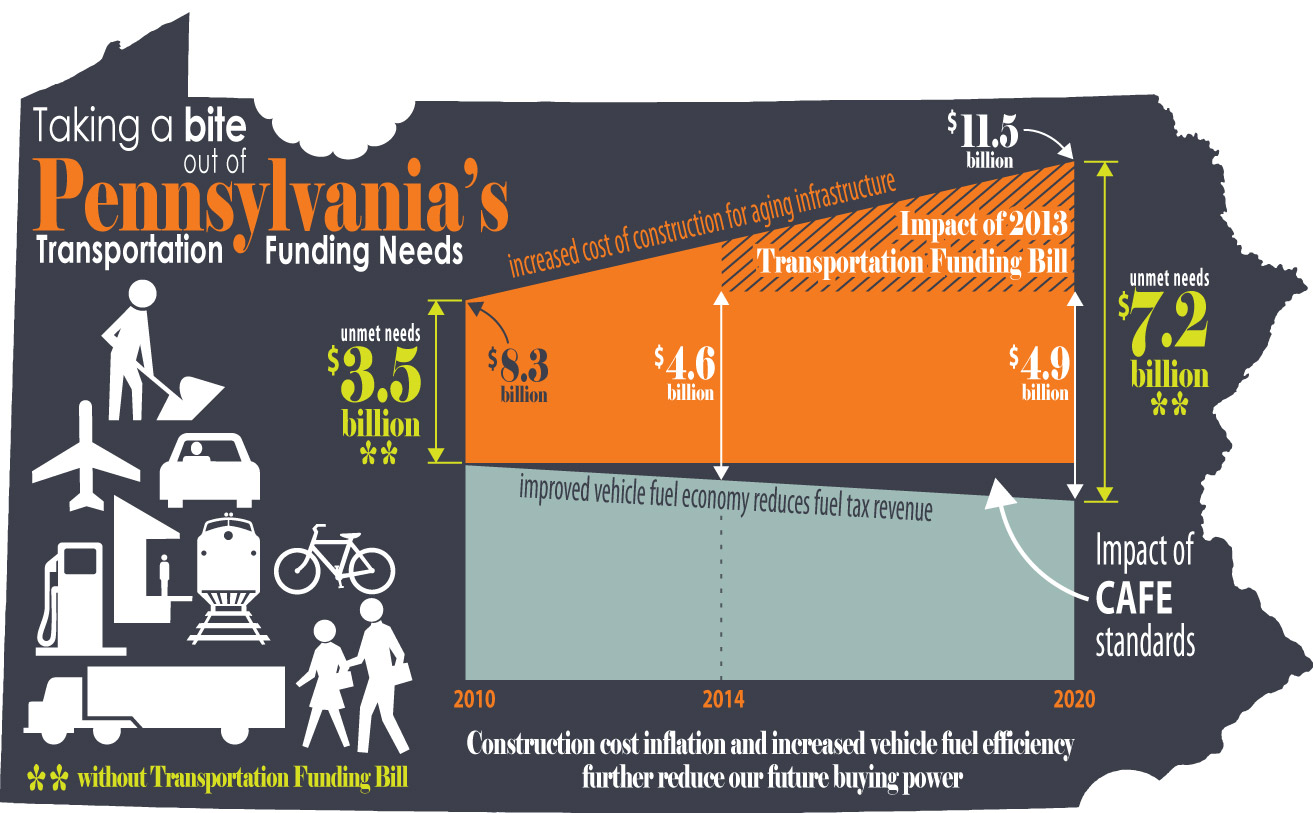 In 2013, Pennsylvania stepped up to start addressing these problems with a transportation funding package, but even with it, there’s still more work to be done than the funding that’s available. Also, if Congress fails to come up with their promised funding by the end of August, this could set Pennsylvania back in spite of trying to catch up on their transportation needs. Pennsylvania has done their part, Congress should really get to work on theirs.
Want to find out more about Pennsylvania’s other infrastructure? Start with the 2014 Report Card for Pennsylvania’s Infrastructure!
Images created by Jason Forbes of McCormick Taylor
In 2013, Pennsylvania stepped up to start addressing these problems with a transportation funding package, but even with it, there’s still more work to be done than the funding that’s available. Also, if Congress fails to come up with their promised funding by the end of August, this could set Pennsylvania back in spite of trying to catch up on their transportation needs. Pennsylvania has done their part, Congress should really get to work on theirs.
Want to find out more about Pennsylvania’s other infrastructure? Start with the 2014 Report Card for Pennsylvania’s Infrastructure!
Images created by Jason Forbes of McCormick Taylor
Tags: #fixthetrustfund, bridges, congress, Pennsylvania, report card
No Comments »
Elementary School Has Energy to Sell Back to the Grid
July 14th, 2014 | By: Infrastructure Report Card
 Aging buildings and energy costs are two of a school’s most concerning issues, but not for Warren County, Kentucky’s Richardsville Elementary School after a sustainable redesign that now has the school selling energy back to the grid. But it hasn’t always been this way. Until Richardsville Elementary School was rebuilt in 2010, classes were held in an obsolete 60-year-old building with dismal lighting and no handicapped access. Because of a local bipartisan initiative to use green building policies to provide cost savings, Richardsville was rebuilt to use only one-quarter the energy of an average school, tackling both issues of age and energy at once. The Warren County school system estimates that due to these policies focused on conserving energy in construction and operations, the savings exceeded $7 million, which was credited for avoiding teacher layoffs in a tough economy. Additionally, the school’s 2,700 rooftop solar panels produce enough power for the school district to actually sell electricity back to the grid, while geothermal pumps provide heating and cooling by using the earth’s underground temperature. Other technologies like lighting reflectors and motion sensors in rooms improve energy use throughout the school, and students and teachers are encouraged to understand and utilize the building in their learning and explain how renewable energy works and conservation really work.
Highway Fix Still Uncertain as USDOT Puts State Agencies on Notice
July 1st, 2014 | By: Infrastructure Report Card
The stakes just got raised even while it seems we are no closer to a funding fix. The U.S. Secretary of Transportation Anthony Foxx announced plans for slowing reimbursements to states from the traditional twice a day method to every other week, starting on August 1 due to the low balance in the Fund. The U.S. Department of Transportation cites on average that states will see a 28 percent drop in federal transportation dollars due to delayed payments. This piecemeal approach to funding federal highway projects may put many current projects on hold, slow down the advertisement of new projects, or even cancel proposed projects. Meanwhile, the U.S. Senate Finance Committee held a meeting last week to approve a necessary fix to the federal Highway Trust Fund (HTF) crisis, but it quickly devolved into an ideological tussle over two things: taxes and spending. The only thing that became clearer after the committee meeting was how far apart Democrats and Republicans are in their preferred solution to the ailing federal transportation program. Solutions spanned a list of items ranging from those that wanted to add more money for transportation, like raising the gas tax and establishing an infrastructure finance authority, to those that wanted to change parts of the current program, like eliminating bicycle infrastructure and allowing states to opt-out of the federal program. Finance Committee Chairman Ron Wyden (D-OR) and Ranking Member Orrin Hatch (R-UT) have pledged to try and navigate this divide and work together in order to reach agreement when Congress returns on July 7. The two sides could agree on less controversial ideas like changes regarding mortgage reporting and pension plans, and efforts to generate funds from those who owe federal taxes, and stave-off a fiscal crisis this year. ASCE is urging the public to visit FixTheTrustFund.org and tell members of Congress to stabilize the Highway Trust Fund and prevent a shutdown of federal highway and public transportation investments across the country.Tags: congress, gas tax, highway trust fund, transportation
No Comments »