2015 Infrastructure Year in Review
January 4th, 2016 | By: America's Infrastructure Report Card
App Makes Contacting Legislators a Breeze
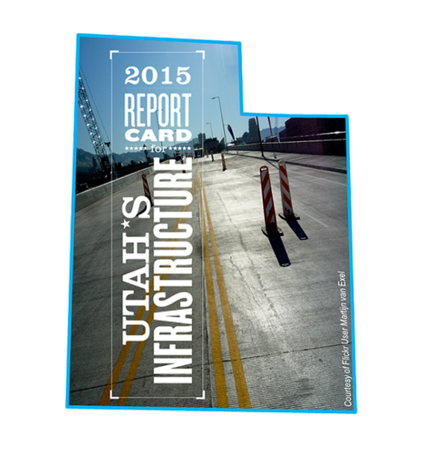 In 2015, both Utah and Iowa rapidly passed transportation legislation reforms on the heels of the release of ASCE’s State Infrastructure Report Cards. In fact, ASCE has released a recent Report Card in 12 of the 15 states that have taken recent significant action on infrastructure. These states include: GA, ID, IA, KY, MD, NE, NH, NC, PA, SD, UT, VT, VA, WA, and WY.
Sharing the Report Card with Business and Industry Leaders
The Report Card for America’s Infrastructure continues to draw interest from business and industry groups nationwide. Almost 50 Report Card presentations have been given by ASCE leaders to groups ranging from the Dallas Regional Chamber of Commerce to the US/Canada P3 Forum to the Association of Actuaries. Request a presentation to your group by emailing reportcard@asce.org.
 Highlighting #GameChangers and Solutions
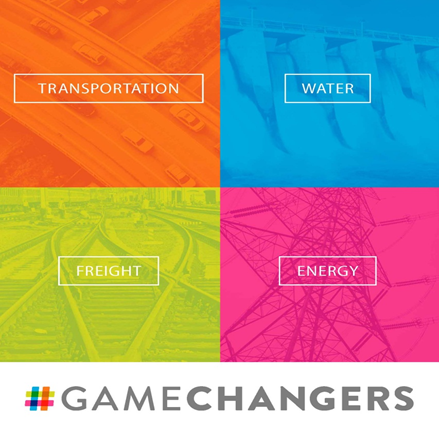
In July, ASCE released Infrastructure #GameChangers report to highlight the innovative ways communities across the country are modernizing infrastructure. The report highlights trends in energy, freight, transportation and water infrastructure that are changing the way we design, plan, and build projects of the future.
Read the full ASCE 2015 Year in Review here.
Alabama’s Infrastructure Grades Are In
December 10th, 2015 | By: Becky Moylan
 The inaugural Report Card for Alabama’s Infrastructure, released today, reveals that Alabama’s aging infrastructure needs attention, especially its dams. As the only state without a dam safety program, Alabama does not have a complete inventory of all the dams in the state. Without this, Alabama is unaware of its dam safety risk. At the last survey in the 1980s, 147 high hazard dams were found and do not have Emergency Action Plans. Because of the unknowns surrounding Alabama’s dams, the Report Card graded it an “Incomplete,” signified by a question mark to demonstrate the uncertainty caused by of a lack of inventory and dam safety program.
With a cumulative grade point average of “C-,”Alabama’s infrastructure is only as strong as its weakest link. All of the highest grades are linked to the lowest grades in the report, as infrastructure works as a system. Plans and funding to address the state’s aging infrastructure assets fall significantly short of needs. Of note:
- Only an estimated 2% of all known dams in Alabama are being inspected for safety, maintained, and have emergency action plans in place for use in the case of an incident or failure. Without a dam safety program, communities that live under dams may not be aware of their risk, and emergency action plans for high hazard dams may not be in place to mitigate property damage and save lives in the case of a breach or failure.
- The majority of the state’s drinking water infrastructure was installed from the 1960s to the 1980s and operating beyond their useful design life.
- 1 in 3 wastewater utility providers statewide report having inadequate rate structures to cover normal operating expenses.
- Septic systems are commonly used in more rural parts of Alabama; 25% of the estimated 850,000 on-site septic systems are in failing or failed condition and could be polluting the community’s groundwater.
- Alabama has 1,388 structurally deficient bridges, ranking 15th most in the country, with many of these being bridges funded and maintained locally.
- Nearly 50% of interstate and state highways are in fair, poor, or very poor condition. Driving on rough and congested roads costs the average Alabama driver at least $300 a year in extra vehicle repairs.
- Much of the inland waterway lock and dam infrastructure within the state is breaking down and has passed the 50 year design service life or is approaching it. As an example, Coffeeville Lock and Dam has a throughput of 10 million tons in spite of vessel delay rates and durations in excess of 90% and 150 hours.
- Finish the dams inventory and pass legislation to create a dam safety program, establish emergency action plans, and use periodic safety inspections to keep communities safe.
- Prioritize routine maintenance to save money and prevent emergency repairs across all infrastructure types.
- Increase replacement of structurally deficient bridges, which are mostly owned and operated locally.
- Create state funding strategies that recognize the importance of functional drinking water, stormwater, and sewer infrastructure to support the economic development of Alabama.
New York Infrastructure Receives C- Report Card
September 29th, 2015 | By: America's Infrastructure Report Card
 In the inaugural 2015 Report Card for New York’s Infrastructure released today, the state received an overall grade of “C-” from the New York Council of the American Society of Civil Engineers. Assessing nine categories, the report finds that the state’s roads and bridges are among the categories most in need of repair, receiving grades of “D-” and “D+” respectively because of their state of deterioration and lack of adequate funding to improve conditions. In addition, wastewater received a low grade of “D.” The category of parks and solid waste both earned the highest grade of “B-.”
New York’s infrastructure faces several challenges and, in its current condition, the infrastructure system is a drag on the state’s economy. These challenges are highlighted in the Report Card:
- The three airports servicing New York City account for a majority of the nation’s airport delays. By the year 2030, JFK is expected to exceed its current traveler capacity by 30%, and ten other commercial service airports in New York will also exceed 60% of the current capacities.
- Of New York’s more than 17,000 bridges, the majority were built in the 20th century, with over 50% of bridges over 75 years old. Nationally, the average age of a bridge is 42 years.
- The average New York City area commuter, which accounts for half the state’s population, wastes 53 hours per year sitting in traffic.
- Poor road conditions and traffic congestion cost motorists a total of $6.3 billion statewide—an average of $477 per Syracuse motorists.
- The State of New York is only spending 20% of what is needed to modernize the wastewater system.
- One in every four of New York’s wastewater facilities are operating beyond their 30-year useful life expectancy.

- Create a prioritization program to assess the state’s transportation infrastructure needs starting from existing bridge asset management programs and based on accepted standards.
- Develop more consistent funding sources of funding for dams and support the creation of dam rehabilitation funding legislation at the federal and state levels for public and private owners of high hazard and intermediate hazard dams.
- As infrastructure is being rebuilt, make it more resilient and sustainable.
View the full report here.
Founded in 1852, the American Society of Civil Engineers represents more than 145,000 civil engineers worldwide and is America’s oldest national engineering society. ASCE’s 2013 Report Card for America’s Infrastructure, graded America’s cumulative GPA for infrastructure at a D+. The Report Card app for Apple and Android devices includes videos, interactive maps and info-graphics that tell the story behind the grades, as well as key facts for all 50 states.New Report Card for Illinois' Infrastructure Shows Progress
April 2nd, 2014 | By: Infrastructure Report Card
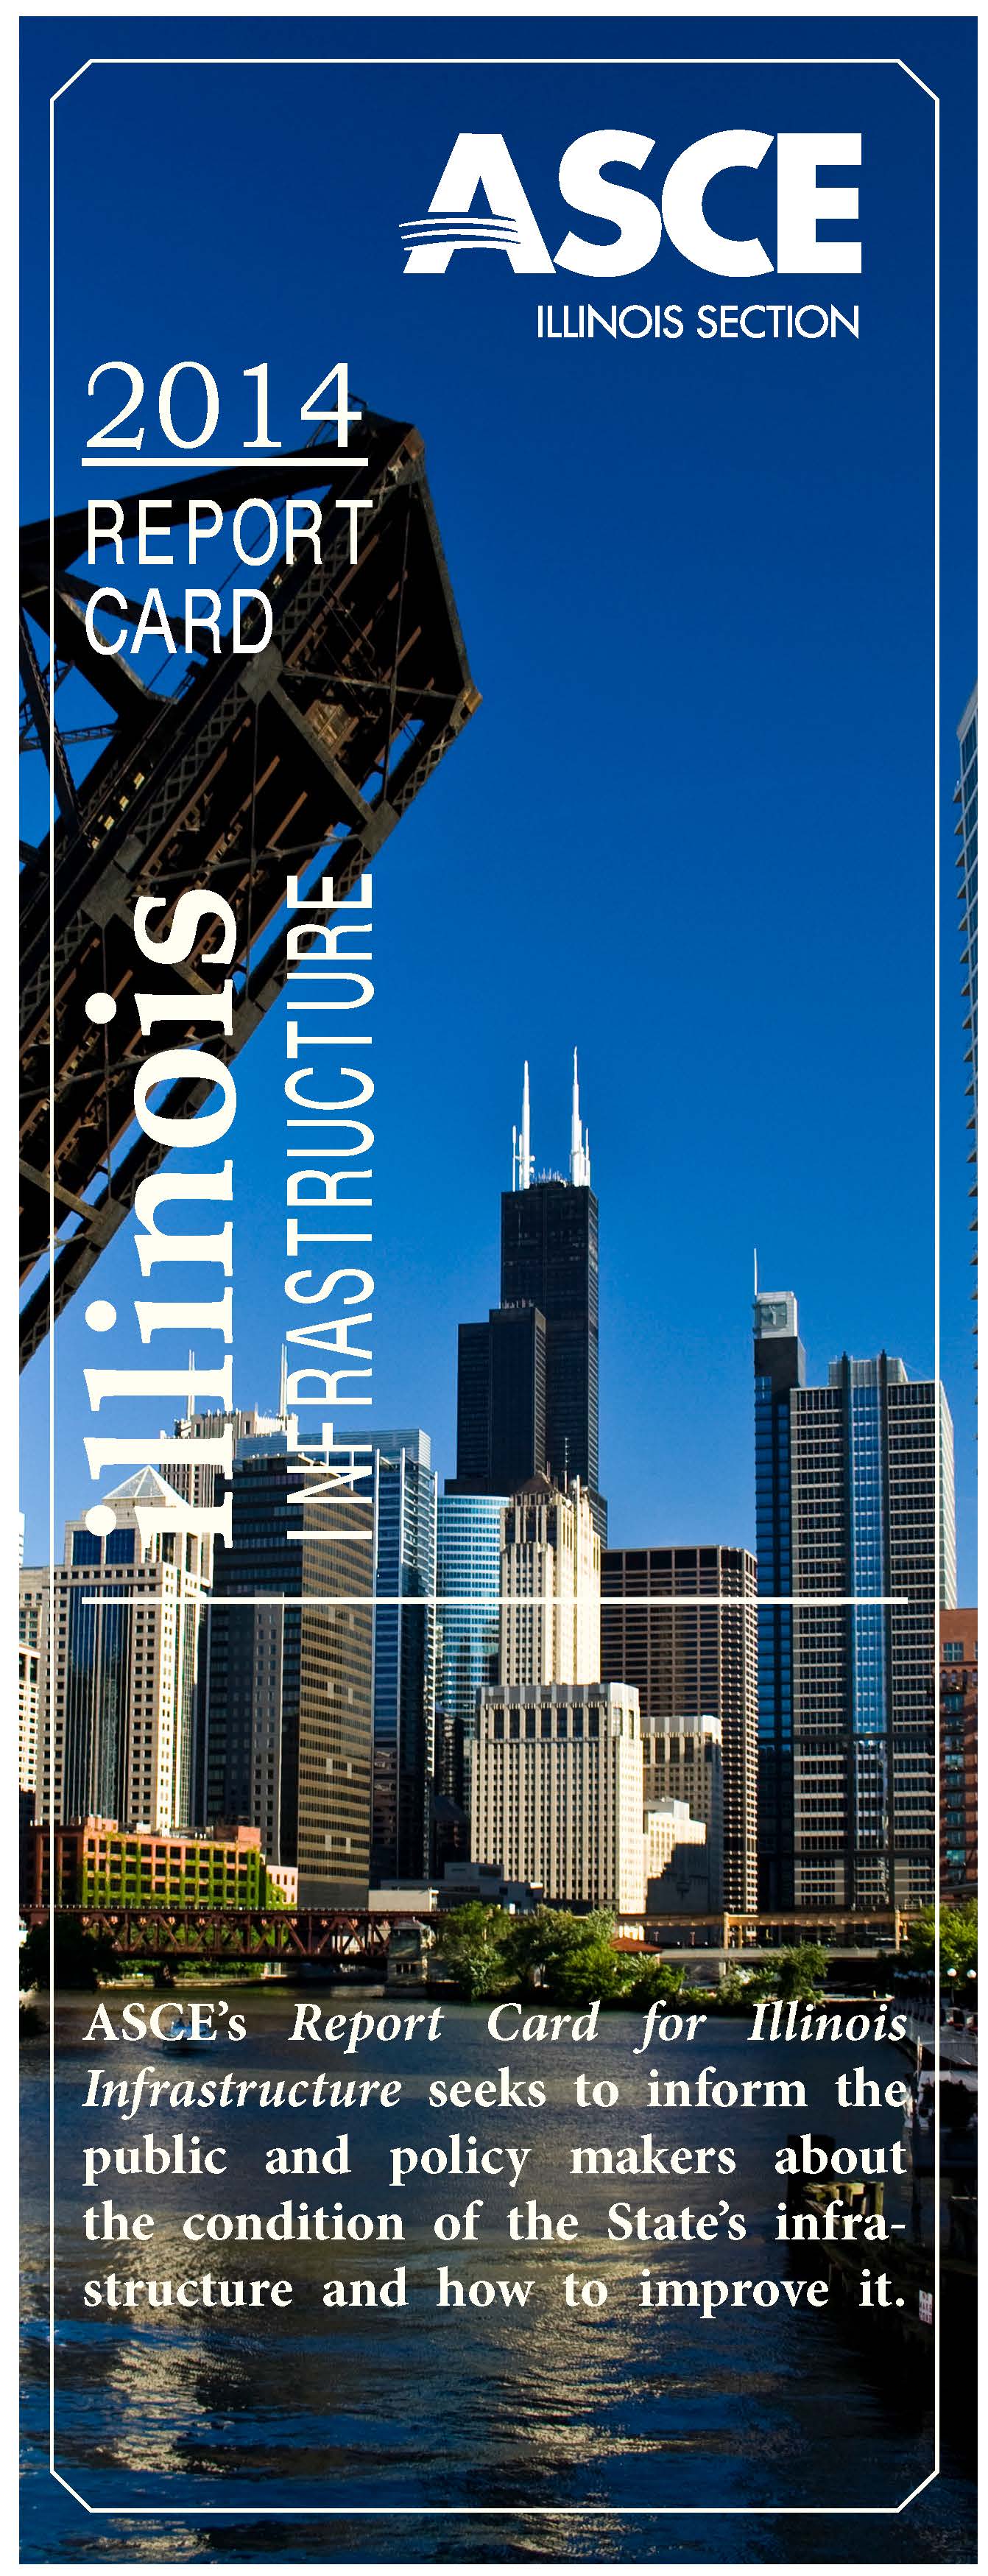 The 2014 Report Card for Illinois’ Infrastructure was released today by the Illinois Sections of the American Society of Civil Engineers (ASCE) at the Illinois Statehouse.
A panel of professional civil engineers throughout the state graded each infrastructure category according to the following eight criteria: capacity, condition, funding, future need, operation and maintenance, public safety, resilience, and innovation. In 2010, the infrastructure grade for Illinois was a D+, reflecting delayed maintenance and underinvestment across most categories. In the 2014 Report Card for Illinois’ Infrastructure, the state’s infrastructure G.P.A. jumped to a C- showing the progress made with leadership and solid infrastructure programs.
Over the past four years since the 2010 Report Card for Illinois’ Infrastructure, leaders at the state level and in Illinois’ cities—large and small—have started to make some steps to rebuild their aging infrastructure. Programs such as CREATE have started unclogging rail and traffic bottlenecks and the Illinois Jobs Now! effort by the state provided $31B to start fixing Illinois’ biggest infrastructure problems. These efforts have paid off and both the Rail and Drinking Water grades have gone up since the last Report Card. Plans like Chicago’s commitment to replace and repair aging water pipes shows how “thinking big” can create even bigger results.
But while some of the grades have gone up, Illinois’ infrastructure isn’t a B student yet. Aging infrastructure and delayed maintenance have taken their toll. Illinois’s average bridge is 40 years old which is close to retirement age for a bridge, Chicago has been replacing water pipes put in when Ulysses Grant was President, and more and more people and goods spend time stuck in traffic on Illinois’ roads and rails.
Let’s Raise the Grades
Illinois’s infrastructure touches almost every aspect of citizens’ daily life—from your neighborhood roads, to your phone, to the community school, to the new south suburban airport. In 2014, we need to be visionary but realistic about our infrastructure. We need to continue replace our oldest infrastructure but also begin to think of our infrastructure as an entire system in need of sustainable funding. We have to make collaborative and smart decisions, while assuring that safety remains our top priority.
We can continue to tackle Illinois’ infrastructure needs by asking our leaders to take on these 3 Key Solutions that would help and raise Illinois’s grades:
1. State and local governments should work together to create smart, efficient transportation systems that meet the changing needs of Illinois’s communities. We cannot just repair the investments of the past, but we need to build systems for a 21st century Illinois.
2. Create sustainable funding to maintain all new and planned investments in Illinois’s water systems. Simply replacing old pipes with limited or no plans for operation and maintenance will only lead to similar problems for future generations.
3. Invest in networks that will lessen the costs of doing business in Illinois, including inland waterways, rail, and airports. As the economy continues to expand, Illinois needs world-class infrastructure to compete with other states for new businesses and manufacturing.
Read the full 2014 Report Card for Illinois’ Infrastructure here.
Tags: Illinois, infrastructure, report card, solutions, transit, transportation, vision, water
No Comments »
Lighting Airports Runways with LEDs Saves Big for Raleigh
December 9th, 2013 | By: Infrastructure Report Card
America needs solutions to our infrastructure issues that can work today, and what if it’s as simple as switching out the lights? The replacement of the entire airfield electrical system at Raleigh-Durham International Airport (RDU) represents the first major air carrier airport in the United States to complete a full airfield conversion to FAA-certified LED airfield lighting. Beginning in 2008, the $20 million, two-year project replaced roughly 230 signs and 3,200 bulbs lighted with incandescent lighting — everything from taxiway edge and centerline lighting to runway centerline lights, obstruction lights, touchdown zone lights, runway end identifier lights, and elevated and in-pavement guard lights — with LED technology. The transition will save approximately $400,000 per year in energy and maintenance costs, including labor and parts. With AIP funds covering 75 percent of Phase One and North Carolina state funds and federal stimulus funds combining for Phase Two, maintenance savings alone are expected to recoup the airport’s portion of the project’s cost within 18 months. Find out more here on RDU’s website.Tags: Airports, energy, infrastructure, infrastructure report card, solutions, transportation
No Comments »


 */ ?>
*/ ?>


