Sometimes It's Best to Look Beneath You: A Successful Geothermal Project at Portland International Jetport
July 1st, 2014 | By: Infrastructure Report Card
 Commit to Success
America’s infrastructure needs a national commitment to bring existing infrastructure into a state-of-good-repair, and in the long term we must modernize and build in a targeted and strategic manner. This means leadership at the federal, state, and local levels of government, by businesses and individuals, to communicate the importance of our nation’s infrastructure, to craft innovative solutions that reflect the diverse needs of the nation, and to make the investments the system needs. By employing strategies to use every dollar more efficiently and by deploying creative solutions to infrastructure development such as public–private partnerships, we can implement the right projects on time at the right price.
Airport Finds Sustainable Success Underground
Commit to Success
America’s infrastructure needs a national commitment to bring existing infrastructure into a state-of-good-repair, and in the long term we must modernize and build in a targeted and strategic manner. This means leadership at the federal, state, and local levels of government, by businesses and individuals, to communicate the importance of our nation’s infrastructure, to craft innovative solutions that reflect the diverse needs of the nation, and to make the investments the system needs. By employing strategies to use every dollar more efficiently and by deploying creative solutions to infrastructure development such as public–private partnerships, we can implement the right projects on time at the right price.
Airport Finds Sustainable Success Underground The centerpiece of the Portland International Jetport’s $75 million terminal expansion project was the installation of a geothermal heating and cooling system that reduces operating costs and emissions. A creative first in the airport industry, the $3 million project was able to make use of a $2.5 million Federal Aviation Administration (FAA) Voluntary Airport Low Emissions (VALE) grant.
The system will maintain a constant temperature inside the terminal building by injecting heat into the ground during the summer and taking heat out of the ground during the winter. The system has 23 miles of high-density polyethylene piping and 120 ground wells that reach as deep as 500 feet. The system moves more than 475 gallons of water per minute with a 125 horsepower pump.
The new systems replace an oil-fired system and will save $160,000 in operating costs and prevent the emission of 1,000 tons of carbon per year, promoting both healthier infrastructure and alternative energy.
The centerpiece of the Portland International Jetport’s $75 million terminal expansion project was the installation of a geothermal heating and cooling system that reduces operating costs and emissions. A creative first in the airport industry, the $3 million project was able to make use of a $2.5 million Federal Aviation Administration (FAA) Voluntary Airport Low Emissions (VALE) grant.
The system will maintain a constant temperature inside the terminal building by injecting heat into the ground during the summer and taking heat out of the ground during the winter. The system has 23 miles of high-density polyethylene piping and 120 ground wells that reach as deep as 500 feet. The system moves more than 475 gallons of water per minute with a 125 horsepower pump.
The new systems replace an oil-fired system and will save $160,000 in operating costs and prevent the emission of 1,000 tons of carbon per year, promoting both healthier infrastructure and alternative energy.
Tags: aviation, energy, Maine, report card, success, sustaina
1 Comment »
What They're Saying About the Pennsylvania Report Card
June 30th, 2014 | By: Infrastructure Report Card
 Watch clips from the release events speakers here, courtesy of Urban Engineers.
- Engineers grade Pa.’s infrastructure: C-minus – Philly.com
- Engineering Group Gives Low Marks to Pennsylvania Infrastructure -CBS Local – Philly
- Pa. Infrastructure Grades Suffer Due To Poor Roads, Bridges – CBS Local – Pittsburgh
- State’s civil engineers give roads a D- in latest “report card” – Pittsburgh Post Gazette
- Pennsylvania earns seven D’s in engineers’ infrastructure report card – The Express-Times
- Pennsylvania’s new infrastructure report card averages to a C minus – Pennlive.com
- Civil engineers give Pennsylvania low marks on infrastructure report card – WFMZ
- State Report Card: Pa. Nearly Fails in Bridges, Water, Roads – NBC 10 Philadelphia
- Pennsylvania’s new infrastructure report card averages to a C minus -The Patriot-News
- Civil engineers: More infrastructure spending is needed – Allentown Morning Call
- Grades not good in engineers’ study of Pa.’s infrastructure – WFMZ Allentown
- Commonwealth infrastructure reaches almost an ‘F’ -FOX43.com
- Report: 1 in 4 PA bridges structurally deficient – Fox 43
- Pennsylvania earns seven D’s in engineers’ infrastructure report card – Lehigh Valley Live
- Pennsylvania gets seven D’s in infrastructure report – Central Penn Business Journal
- Engineers grade Pa.’s infrastructure: C-minus – Bloomberg Businessweek
- State infrastructure gets a C-minus grade – Delaware County Daily Times
- Pa.’s infrastructure barely makes the grade – Newsworks.org
Tags: news, Outreach, Pennsylvania, report card
No Comments »
Pennsylvania Earns 7 Poor D Grades in New Report Card
June 25th, 2014 | By: Infrastructure Report Card
![]()
- Pennsylvania has the highest percentage of structurally deficient bridges in the country. Of the Commonwealth’s more than 22,000 bridges, nearly one in four are considered structurally deficient.
- Pennsylvania has the most combined sewer overflows (CSOs) of any state.
- The Commonwealth must invest $28 billion over the next 20 years to repair existing wastewater systems, meet clean water standards and build or expand existing systems to meet increasing demands
- Pennsylvania’s 1.3 traffic fatalities per 100 million miles of travel is significantly higher than the national average (1.1).
- KEEP UP THE MOMENTUM FOR BETTER INFRASTRUCTURE: In 2013, Pennsylvania’s officials showed leadership by passing a transportation package that will start putting the roads, bridges, and transit systems back into working order.
- AFFIRM PUBLIC SAFETY AS GOVERNMENT’S #1 JOB:Whether it’s repairs to bridges, ensuring safe drinking water, or keeping up on dam safety inspections, public safety must always be the first priority as leaders budget and plan for the future. Ensuring infrastructure is resilient and online 99.9% of the time will keep communities safe and the economy thriving.
- STOP WASTING MONEY BY WAITING: Of the 7 infrastructure categories with D grades, all of these deal with transportation and water systems, and much of the repairs and long-term funding are being short-changed. Waiting will only lead to larger issues that will disrupt lives and cost even more when the bill comes due. Pennsylvania must look at the full cost of decisions and then put savings to use.
Tags: Act-89, grades, momentum, Pennsylvania, report card, states, transportation, water
No Comments »
Will Pennsylvania's Infrastructure Make the Grade?
June 19th, 2014 | By: Infrastructure Report Card

Infrastructure has a direct impact on our lives every day—from the water we drink, to the schools our children attend and to the roads and rails we travel.
Join us for one of ASCE’s release events for the ![]() Wednesday, June 25, 2014
Wednesday, June 25, 2014
- State Senator John Rafferty, Jr., Chairman of Senate Transportation Committee
- Harry Campbell, Pennsylvania Executive Director, Chesapeake Bay Foundation
- Randall Over, ASCE National President
- Jason Bowes, ASCE Central PA Section President
- Darin Gatti, Chief Engineer, Philadelphia Streets Department
- Jeffrey Knueppel, Deputy General Manager, SEPTA
- Lester Toaso, District Executive, PennDOT District 6-0
- Daniel Cessna PE, PennDOT Engineering District 11, District Executive
- Dennis Davin, Allegheny County, Director of Economic Development
- Bill Flanagan, Allegheny Conference on Community Development Executive Vice President, Corporate Relations
- Michael W. Rebert, P.E., PennDOT Engineering District 5, District Executive
- Becky Bradley, Executive Director of the Lehigh Valley Planning Commission
- Aurel Arndt, General Manager, Lehigh County Authority, Allentown, PA
RSVP to reportcard@asce.org
Tags: event, infrastructure, media, Pennsylvania, report card
No Comments »
New Report Card for Illinois' Infrastructure Shows Progress
April 2nd, 2014 | By: Infrastructure Report Card
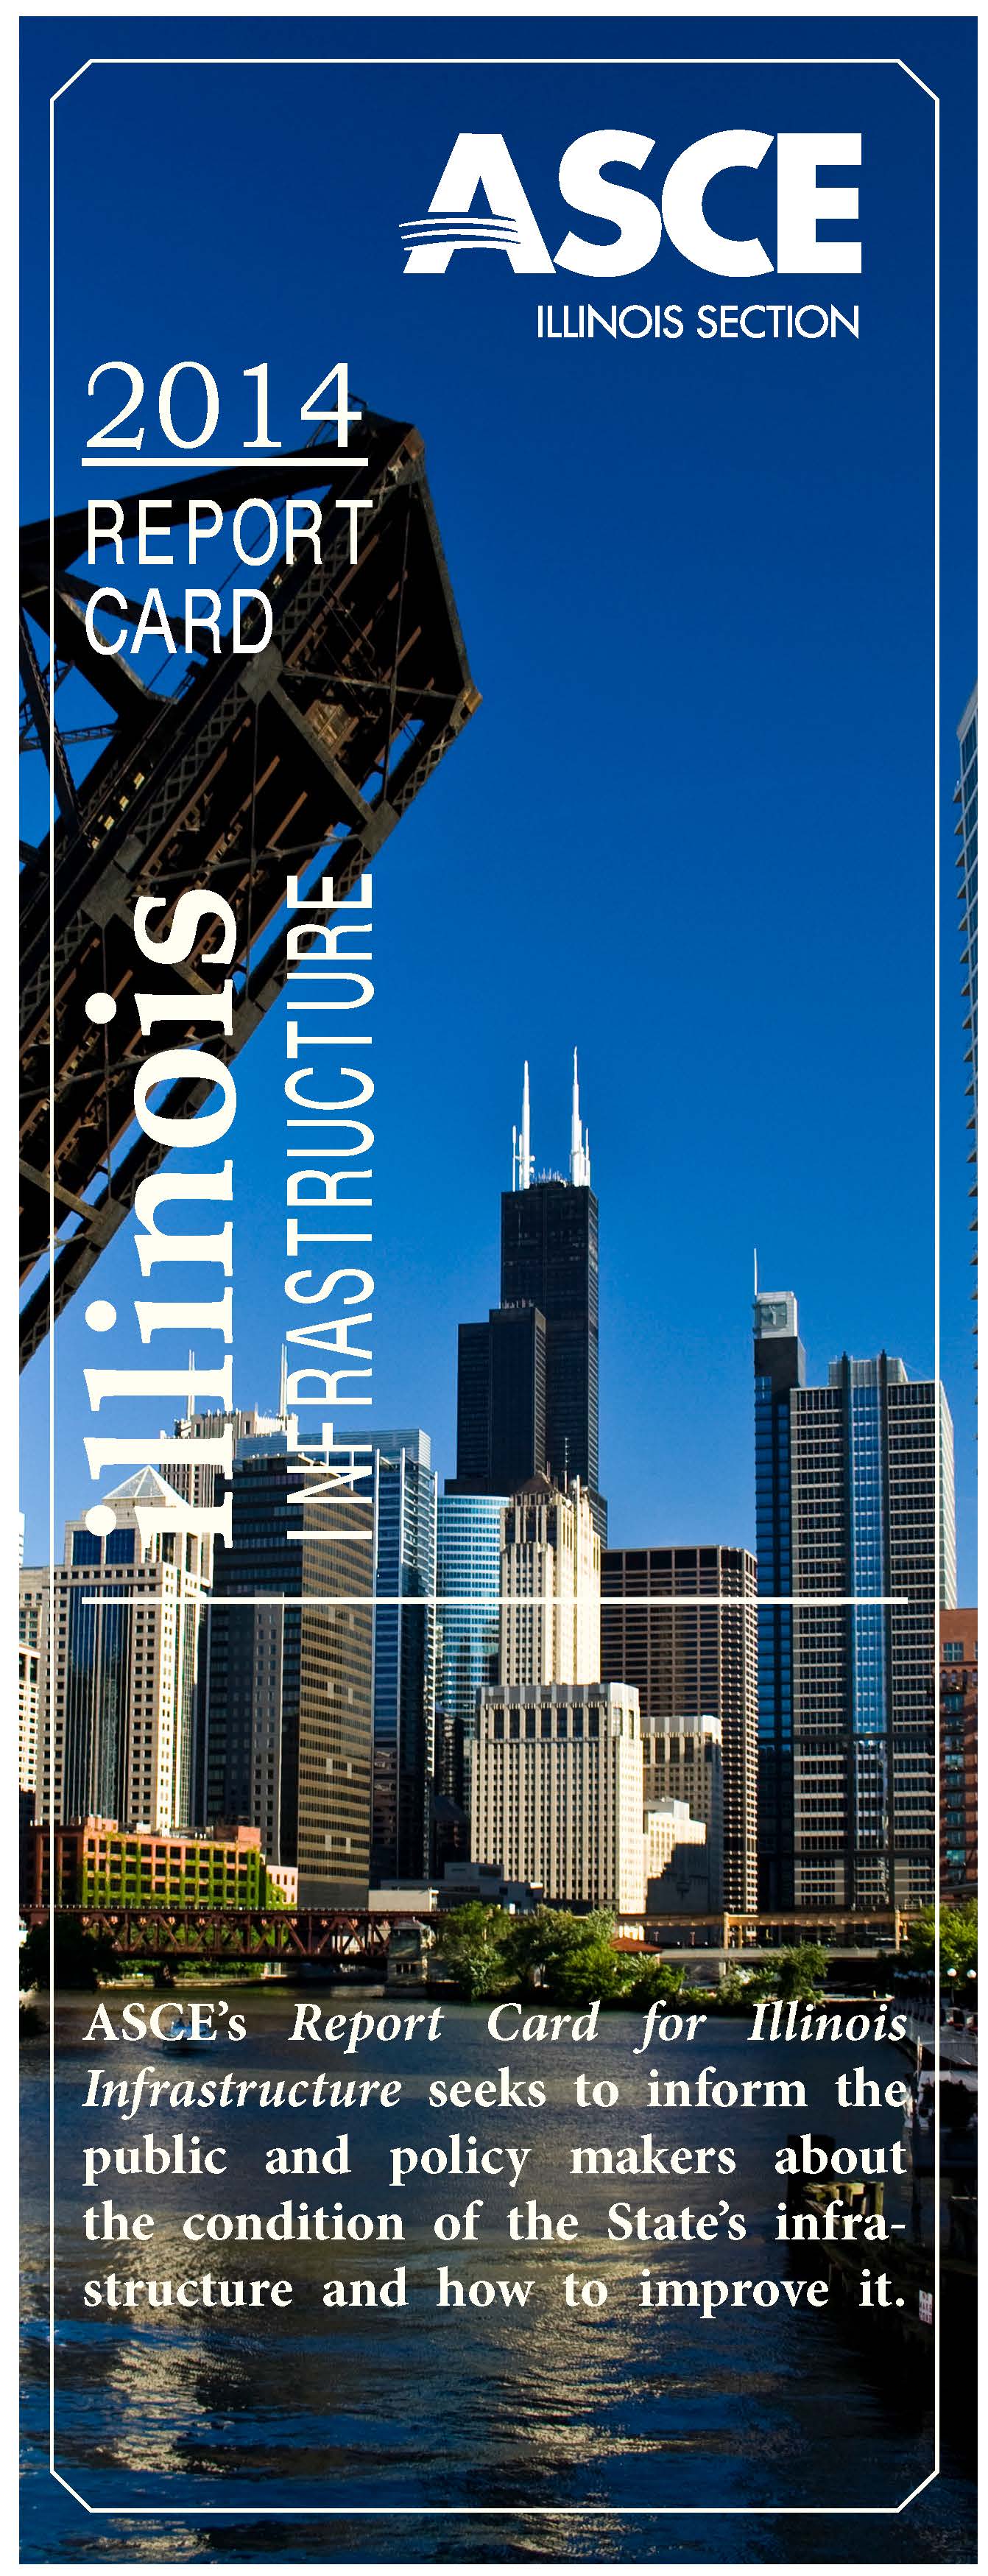 The 2014 Report Card for Illinois’ Infrastructure was released today by the Illinois Sections of the American Society of Civil Engineers (ASCE) at the Illinois Statehouse.
A panel of professional civil engineers throughout the state graded each infrastructure category according to the following eight criteria: capacity, condition, funding, future need, operation and maintenance, public safety, resilience, and innovation. In 2010, the infrastructure grade for Illinois was a D+, reflecting delayed maintenance and underinvestment across most categories. In the 2014 Report Card for Illinois’ Infrastructure, the state’s infrastructure G.P.A. jumped to a C- showing the progress made with leadership and solid infrastructure programs.
Over the past four years since the 2010 Report Card for Illinois’ Infrastructure, leaders at the state level and in Illinois’ cities—large and small—have started to make some steps to rebuild their aging infrastructure. Programs such as CREATE have started unclogging rail and traffic bottlenecks and the Illinois Jobs Now! effort by the state provided $31B to start fixing Illinois’ biggest infrastructure problems. These efforts have paid off and both the Rail and Drinking Water grades have gone up since the last Report Card. Plans like Chicago’s commitment to replace and repair aging water pipes shows how “thinking big” can create even bigger results.
But while some of the grades have gone up, Illinois’ infrastructure isn’t a B student yet. Aging infrastructure and delayed maintenance have taken their toll. Illinois’s average bridge is 40 years old which is close to retirement age for a bridge, Chicago has been replacing water pipes put in when Ulysses Grant was President, and more and more people and goods spend time stuck in traffic on Illinois’ roads and rails.
Let’s Raise the Grades
Illinois’s infrastructure touches almost every aspect of citizens’ daily life—from your neighborhood roads, to your phone, to the community school, to the new south suburban airport. In 2014, we need to be visionary but realistic about our infrastructure. We need to continue replace our oldest infrastructure but also begin to think of our infrastructure as an entire system in need of sustainable funding. We have to make collaborative and smart decisions, while assuring that safety remains our top priority.
We can continue to tackle Illinois’ infrastructure needs by asking our leaders to take on these 3 Key Solutions that would help and raise Illinois’s grades:
1. State and local governments should work together to create smart, efficient transportation systems that meet the changing needs of Illinois’s communities. We cannot just repair the investments of the past, but we need to build systems for a 21st century Illinois.
2. Create sustainable funding to maintain all new and planned investments in Illinois’s water systems. Simply replacing old pipes with limited or no plans for operation and maintenance will only lead to similar problems for future generations.
3. Invest in networks that will lessen the costs of doing business in Illinois, including inland waterways, rail, and airports. As the economy continues to expand, Illinois needs world-class infrastructure to compete with other states for new businesses and manufacturing.
Read the full 2014 Report Card for Illinois’ Infrastructure here.
The 2014 Report Card for Illinois’ Infrastructure was released today by the Illinois Sections of the American Society of Civil Engineers (ASCE) at the Illinois Statehouse.
A panel of professional civil engineers throughout the state graded each infrastructure category according to the following eight criteria: capacity, condition, funding, future need, operation and maintenance, public safety, resilience, and innovation. In 2010, the infrastructure grade for Illinois was a D+, reflecting delayed maintenance and underinvestment across most categories. In the 2014 Report Card for Illinois’ Infrastructure, the state’s infrastructure G.P.A. jumped to a C- showing the progress made with leadership and solid infrastructure programs.
Over the past four years since the 2010 Report Card for Illinois’ Infrastructure, leaders at the state level and in Illinois’ cities—large and small—have started to make some steps to rebuild their aging infrastructure. Programs such as CREATE have started unclogging rail and traffic bottlenecks and the Illinois Jobs Now! effort by the state provided $31B to start fixing Illinois’ biggest infrastructure problems. These efforts have paid off and both the Rail and Drinking Water grades have gone up since the last Report Card. Plans like Chicago’s commitment to replace and repair aging water pipes shows how “thinking big” can create even bigger results.
But while some of the grades have gone up, Illinois’ infrastructure isn’t a B student yet. Aging infrastructure and delayed maintenance have taken their toll. Illinois’s average bridge is 40 years old which is close to retirement age for a bridge, Chicago has been replacing water pipes put in when Ulysses Grant was President, and more and more people and goods spend time stuck in traffic on Illinois’ roads and rails.
Let’s Raise the Grades
Illinois’s infrastructure touches almost every aspect of citizens’ daily life—from your neighborhood roads, to your phone, to the community school, to the new south suburban airport. In 2014, we need to be visionary but realistic about our infrastructure. We need to continue replace our oldest infrastructure but also begin to think of our infrastructure as an entire system in need of sustainable funding. We have to make collaborative and smart decisions, while assuring that safety remains our top priority.
We can continue to tackle Illinois’ infrastructure needs by asking our leaders to take on these 3 Key Solutions that would help and raise Illinois’s grades:
1. State and local governments should work together to create smart, efficient transportation systems that meet the changing needs of Illinois’s communities. We cannot just repair the investments of the past, but we need to build systems for a 21st century Illinois.
2. Create sustainable funding to maintain all new and planned investments in Illinois’s water systems. Simply replacing old pipes with limited or no plans for operation and maintenance will only lead to similar problems for future generations.
3. Invest in networks that will lessen the costs of doing business in Illinois, including inland waterways, rail, and airports. As the economy continues to expand, Illinois needs world-class infrastructure to compete with other states for new businesses and manufacturing.
Read the full 2014 Report Card for Illinois’ Infrastructure here.
Tags: Illinois, infrastructure, report card, solutions, transit, transportation, vision, water
No Comments »
Success Story: Louisville’s Riverbank Filtration Projects are Innovating with Nature
February 12th, 2014 | By: Infrastructure Report Card
When change is needed, water utilities like the Louisville Water Company also look to see what else can be improved in the process. The Riverbank Filtration Tunnel and Pump Station project at the B.E. Payne Treatment Plant was developed in Louisville to exceed new regulations that took effect in 2012 by the Safe Drinking Water Act. This new video explains how this innovative project works to harness nature to better serve their community. The project includes combining a gravity tunnel with wells as a source for drinking water, making the Louisville Water Company the first water utility in the world to do so. The project uses the Riverbank Filtration process—a “green supply” purification method using natural filtering of a riverbank to remove contaminants. By using a natural filtration process, the project saves the state money and will result in fewer water main issues. To learn more about the project, visit the project profile or this article. If you’d like to know more about Kentucky’s infrastructure, get a great summary of the issues here in their Infrastructure Report Card.Tags: Kentucky, report card, success, sustainability, water
No Comments »
Georgia's C Infrastructure
January 13th, 2014 | By: Infrastructure Report Card
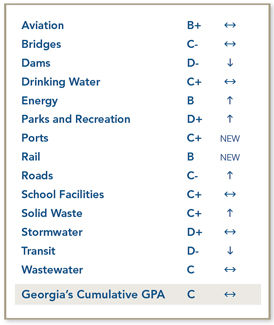
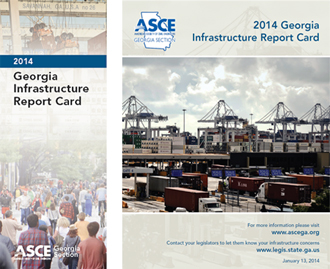 Georgia’s infrastructure has failed to improve over the last five years. In a new report, titled the 2014 Report Card for Georgia’s Infrastructure, the Georgia Section of the American Society of Civil Engineers (ASCE) awarded the state’s infrastructure a “C,” a grade unchanged from their 2009 Report Card. The lowest grade awarded was a “D-”, which went to the state’s dams and transit systems. The Report Card’s highest grade, a “B,” was given to Georgia’s energy and rail systems. Georgia’s growing population combined with cutbacks in infrastructure funding resulted in many of the low grades.
Specifically, the Report Card finds that Georgia is lagging in sustainable investment, including:
Georgia’s infrastructure has failed to improve over the last five years. In a new report, titled the 2014 Report Card for Georgia’s Infrastructure, the Georgia Section of the American Society of Civil Engineers (ASCE) awarded the state’s infrastructure a “C,” a grade unchanged from their 2009 Report Card. The lowest grade awarded was a “D-”, which went to the state’s dams and transit systems. The Report Card’s highest grade, a “B,” was given to Georgia’s energy and rail systems. Georgia’s growing population combined with cutbacks in infrastructure funding resulted in many of the low grades.
Specifically, the Report Card finds that Georgia is lagging in sustainable investment, including:
- Georgia ranks 49th in the nation in per capita transportation funding.
- Georgia is among the lowest in the country in transit spending per resident. According to the American Public Transportation Association’s 2010 Survey of State Funding for Public Transportation, Georgia spent just $0.63 per person in 2008. In comparison, New Jersey spent $119.52, Illinois spent $40.43, and North Carolina spent $7.94 per person in the same year.
- Georgia’s Safe Dams Program has faced over a 50% cut in staff since 2003, with each safety official now expected to oversee over 1,000 dams, or five times the national average.
- MARTA is the largest transit agency in the country to not receive state funding support for operations
- Georgia’s state motor fuel excise tax—which funds surface transportation projects—is one of the lowest in the United States
Tags: dams, grades, infrastructure, report card, state, transit, transportation, water
1 Comment »
Infrastructure Is the Missing Ingredient to Healthy School Lunches
December 30th, 2013 | By: Infrastructure Report Card
 The Kids’ Safe and Healthful Foods Project lead by The Pew Charitable Trusts and the Robert Wood Johnson Foundation released a report this December titled, Serving Healthy School Meals: U.S. Schools Need Updated Kitchen Equipment. They found that 55% of school food authorities (SFAs) need kitchen infrastructure changes at one or more schools to meet new healthy lunch requirements. That’s right – the majority of America’s schools need to fix their school’s infrastructure problems in order to serve up healthy school lunches every day.
Here’s a few of their key findings:
The Kids’ Safe and Healthful Foods Project lead by The Pew Charitable Trusts and the Robert Wood Johnson Foundation released a report this December titled, Serving Healthy School Meals: U.S. Schools Need Updated Kitchen Equipment. They found that 55% of school food authorities (SFAs) need kitchen infrastructure changes at one or more schools to meet new healthy lunch requirements. That’s right – the majority of America’s schools need to fix their school’s infrastructure problems in order to serve up healthy school lunches every day.
Here’s a few of their key findings:


Tags: infrastructure, infrastructure investment, report card, schools, state
No Comments »
Celebrating Infrastructure Successes in 2013
December 27th, 2013 | By: Infrastructure Report Card
Looking back over 2013, we have many successes in making infrastructure a priority to celebrate. Here are a few that really made our year: 1. The 2013 Report Card for America’s Infrastructure was launched in March as a tablet and smartphone app gaining more traction with the media and decision makers than ever before and was even mentioned by President Obama during a “Rebuilding America” event at the Port of Miami.
2. Stephen Colbert showcased the uptick in America’s Report Card grades as a “Tiny Triumph” on the Colbert Report in April taking the infrastructure message to a whole new audience.
3. The Water Resources Development Act which will greatly help our ports and inland waterways deal with their pressing needs is currently in the hands of a House and Senate conference committee, and we hope to see it enacted early in 2014 (stay tuned!). It’s not too late to tell your member of Congress that this should be on Congress’ 2014 to-do list. Email them right here with a few clicks.
4. Major infrastructure funding legislative initiatives took off in several states including Maryland, Massachusetts, Pennsylvania, Virginia, Vermont, Wyoming, Texas, and Maine.
5. Several new bills were introduced that would start improving the nation’s infrastructure: The Partnership to Build America Act (H.R. 2084), which could re-shape the way infrastructure in the United States is financed; the UPDATE Act (H.R. 3636), which would increase investment in transportation infrastructure through an increase in the federal gas tax/user fee; the BRIDGE Act (S. 1716)/National Infrastructure Development Bank Act (H.R. 2553), both of which would facilitate infrastructure investment through creation of a national infrastructure bank.
1. The 2013 Report Card for America’s Infrastructure was launched in March as a tablet and smartphone app gaining more traction with the media and decision makers than ever before and was even mentioned by President Obama during a “Rebuilding America” event at the Port of Miami.
2. Stephen Colbert showcased the uptick in America’s Report Card grades as a “Tiny Triumph” on the Colbert Report in April taking the infrastructure message to a whole new audience.
3. The Water Resources Development Act which will greatly help our ports and inland waterways deal with their pressing needs is currently in the hands of a House and Senate conference committee, and we hope to see it enacted early in 2014 (stay tuned!). It’s not too late to tell your member of Congress that this should be on Congress’ 2014 to-do list. Email them right here with a few clicks.
4. Major infrastructure funding legislative initiatives took off in several states including Maryland, Massachusetts, Pennsylvania, Virginia, Vermont, Wyoming, Texas, and Maine.
5. Several new bills were introduced that would start improving the nation’s infrastructure: The Partnership to Build America Act (H.R. 2084), which could re-shape the way infrastructure in the United States is financed; the UPDATE Act (H.R. 3636), which would increase investment in transportation infrastructure through an increase in the federal gas tax/user fee; the BRIDGE Act (S. 1716)/National Infrastructure Development Bank Act (H.R. 2553), both of which would facilitate infrastructure investment through creation of a national infrastructure bank.
 6. Five states – North Carolina, Oklahoma, Kansas, Missouri, and Washington – put out state-based Infrastructure Report Cards challenging their state’s leaders to get to work on the infrastructure issues in their area.
Thanks for your support in making these happen and we look forward to making 2014 an even bigger year for infrastructure!
6. Five states – North Carolina, Oklahoma, Kansas, Missouri, and Washington – put out state-based Infrastructure Report Cards challenging their state’s leaders to get to work on the infrastructure issues in their area.
Thanks for your support in making these happen and we look forward to making 2014 an even bigger year for infrastructure!
Tags: app, media, report card, state, state report cards, transportation, water
No Comments »
On Infrastructure, Funding is the Challenge
December 2nd, 2013 | By: America's Infrastructure Report Card
In a recent op-ed in the Wall Street Journal, Philip Howard, of the small-government reform group Common Good, said that when it comes to U.S. infrastructure, “funding is not the challenge.” Where to begin? Funding is an immense, complicated, and ever-changing challenge facing our country’s roads, bridges, water systems, dams, and other infrastructure. Our inability to fund our infrastructure hurts our economic competitiveness, meaning fewer jobs for American families. In the 2013 Report Card for America’s Infrastructure, we found that the U.S. faces a $1.6 trillion infrastructure investment need by 2020. We found that unless our infrastructure investment trajectory changes, the United States will lose 3.5 million jobs and $3.1 trillion in gross domestic product by 2020. Simply, funding our infrastructure and funding for future needs is a colossal challenge—a challenge we are not currently meeting. But don’t just take our word for it. Thomas Donohue, president of the United States Chamber of Commerce, has repeatedly come out in support of raising the federal fuel tax in order to boost federal transportation funding. The American Enterprise Institute, a prominent conservative think-tank, is so concerned about our lack of infrastructure funding that that are hosting a policy discussion this December to share policy ideas to fill our funding gap. Howard’s main argument seems to be that we need to reduce red-tape. Obviously, over-stressed bureaucracy hurts our ability to move projects forward. As we recently saw with the passage of the Water Resources Reform and Development Act, Congress and state legislatures all over the country are working to make the infrastructure process more efficient. Reforms to streamline project delivery are a key part of the equation. However, reforms aren’t enough to cover the investment shortfall we face by 2020, particularly for transportation. In 2015, about one year from now, the Highway Trust Fund will be bankrupt. The Fund supports road, bridge, and mass transit projects across the country. The Fund provides millions of dollars annually to repair and strengthen the economic foundation of our nation. If we fail to act, U.S. highway and transit programs will sustain a 92% cut. If this is not an immediate and pressing funding challenge, then what is? Downplaying the impact of funding on our infrastructure is shortsighted. The longer we wait to act and create sustainable funding mechanisms for our infrastructure, the more it will cost.Tags: Funding, highway trust fund, report card
No Comments »