Pennsylvania Earns 7 Poor D Grades in New Report Card
June 25th, 2014 | By: Infrastructure Report Card
![]()
- Pennsylvania has the highest percentage of structurally deficient bridges in the country. Of the Commonwealth’s more than 22,000 bridges, nearly one in four are considered structurally deficient.
- Pennsylvania has the most combined sewer overflows (CSOs) of any state.
- The Commonwealth must invest $28 billion over the next 20 years to repair existing wastewater systems, meet clean water standards and build or expand existing systems to meet increasing demands
- Pennsylvania’s 1.3 traffic fatalities per 100 million miles of travel is significantly higher than the national average (1.1).
- KEEP UP THE MOMENTUM FOR BETTER INFRASTRUCTURE: In 2013, Pennsylvania’s officials showed leadership by passing a transportation package that will start putting the roads, bridges, and transit systems back into working order.
- AFFIRM PUBLIC SAFETY AS GOVERNMENT’S #1 JOB:Whether it’s repairs to bridges, ensuring safe drinking water, or keeping up on dam safety inspections, public safety must always be the first priority as leaders budget and plan for the future. Ensuring infrastructure is resilient and online 99.9% of the time will keep communities safe and the economy thriving.
- STOP WASTING MONEY BY WAITING: Of the 7 infrastructure categories with D grades, all of these deal with transportation and water systems, and much of the repairs and long-term funding are being short-changed. Waiting will only lead to larger issues that will disrupt lives and cost even more when the bill comes due. Pennsylvania must look at the full cost of decisions and then put savings to use.
Tags: Act-89, grades, momentum, Pennsylvania, report card, states, transportation, water
No Comments »
Georgia's C Infrastructure
January 13th, 2014 | By: Infrastructure Report Card
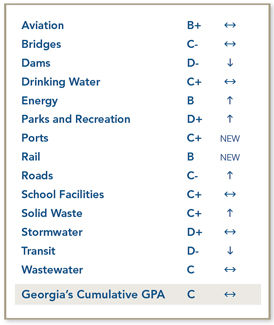
 Georgia’s infrastructure has failed to improve over the last five years. In a new report, titled the 2014 Report Card for Georgia’s Infrastructure, the Georgia Section of the American Society of Civil Engineers (ASCE) awarded the state’s infrastructure a “C,” a grade unchanged from their 2009 Report Card. The lowest grade awarded was a “D-”, which went to the state’s dams and transit systems. The Report Card’s highest grade, a “B,” was given to Georgia’s energy and rail systems. Georgia’s growing population combined with cutbacks in infrastructure funding resulted in many of the low grades.
Specifically, the Report Card finds that Georgia is lagging in sustainable investment, including:
Georgia’s infrastructure has failed to improve over the last five years. In a new report, titled the 2014 Report Card for Georgia’s Infrastructure, the Georgia Section of the American Society of Civil Engineers (ASCE) awarded the state’s infrastructure a “C,” a grade unchanged from their 2009 Report Card. The lowest grade awarded was a “D-”, which went to the state’s dams and transit systems. The Report Card’s highest grade, a “B,” was given to Georgia’s energy and rail systems. Georgia’s growing population combined with cutbacks in infrastructure funding resulted in many of the low grades.
Specifically, the Report Card finds that Georgia is lagging in sustainable investment, including:
- Georgia ranks 49th in the nation in per capita transportation funding.
- Georgia is among the lowest in the country in transit spending per resident. According to the American Public Transportation Association’s 2010 Survey of State Funding for Public Transportation, Georgia spent just $0.63 per person in 2008. In comparison, New Jersey spent $119.52, Illinois spent $40.43, and North Carolina spent $7.94 per person in the same year.
- Georgia’s Safe Dams Program has faced over a 50% cut in staff since 2003, with each safety official now expected to oversee over 1,000 dams, or five times the national average.
- MARTA is the largest transit agency in the country to not receive state funding support for operations
- Georgia’s state motor fuel excise tax—which funds surface transportation projects—is one of the lowest in the United States
Tags: dams, grades, infrastructure, report card, state, transit, transportation, water
1 Comment »