Alabama’s Infrastructure Grades Are In
December 10th, 2015 | By: Becky Moylan
- Only an estimated 2% of all known dams in Alabama are being inspected for safety, maintained, and have emergency action plans in place for use in the case of an incident or failure. Without a dam safety program, communities that live under dams may not be aware of their risk, and emergency action plans for high hazard dams may not be in place to mitigate property damage and save lives in the case of a breach or failure.
- The majority of the state’s drinking water infrastructure was installed from the 1960s to the 1980s and operating beyond their useful design life.
- 1 in 3 wastewater utility providers statewide report having inadequate rate structures to cover normal operating expenses.
- Septic systems are commonly used in more rural parts of Alabama; 25% of the estimated 850,000 on-site septic systems are in failing or failed condition and could be polluting the community’s groundwater.
- Alabama has 1,388 structurally deficient bridges, ranking 15th most in the country, with many of these being bridges funded and maintained locally.
- Nearly 50% of interstate and state highways are in fair, poor, or very poor condition. Driving on rough and congested roads costs the average Alabama driver at least $300 a year in extra vehicle repairs.
- Much of the inland waterway lock and dam infrastructure within the state is breaking down and has passed the 50 year design service life or is approaching it. As an example, Coffeeville Lock and Dam has a throughput of 10 million tons in spite of vessel delay rates and durations in excess of 90% and 150 hours.
- Finish the dams inventory and pass legislation to create a dam safety program, establish emergency action plans, and use periodic safety inspections to keep communities safe.
- Prioritize routine maintenance to save money and prevent emergency repairs across all infrastructure types.
- Increase replacement of structurally deficient bridges, which are mostly owned and operated locally.
- Create state funding strategies that recognize the importance of functional drinking water, stormwater, and sewer infrastructure to support the economic development of Alabama.
Congress Takes First Step to Develop New Water Resources Bill
November 23rd, 2015 | By: Whitford Remer
Several members of Congress from the House Transportation and Infrastructure (T&I) Committee gathered in New Orleans earlier this month to listen to stakeholders offer their wishes for a new water resources bill the Committee has pledged to introduce in 2016. Spearheaded by freshman Congressman Garrett Graves (R-LA), T&I Chairman Bill Shuster (R-PA) and Water Resources Subcommittee Chairman Bob Gibbs (R-OH) joined a roundtable discussion focused mainly on flood control and dredging projects sponsored by the Army Corps of Engineers. The Committee’s goal is get the Water Resources Development Act (WRDA) back on a two-year authorization cycle, after letting the legislation lie fallow for seven years before finally passing a bill in 2014. Stakeholders representing the ports and inland waterways industries focused heavily on Section 7001 of WRDA. That section requires the Corps to submit an annual report to Congress identifying feasibility reports, proposed feasibility studies and proposed modifications to projects or studies. Section 7001 is the way projects get “named” in the absence of earmarks. Panelists noted that in the Corps 2015 report to Congress of the 114 proposals submitted by non-federal sponsors around the country, only 19 were deemed to have satisfied the criteria in Section 7001. Moreover, they continued, all 19 were proposed feasibility studies, meaning that no proposals for project authorizations or project modifications were sent to Congress. The outstanding question is whether the “federal standard” to recommend a project or study is too strict or if there are larger issues with how the standard is being interpreted. Either way, new project authorizations are hard to come by in Congress and the Administration’s budget, slowing necessary infrastructure development down across the country. Another hot topic of discussion was the beneficial use of dredge material. Several stakeholders from Louisiana urged greater flexibility in the use of dredge material. The material is valuable for wetland restoration projects in Southern Louisiana, but current policy often prohibits pumping the material for use in restoration projects and instead contractors are often required to dump it downriver or off the continental shelf. Changes in Corps policy and cost-benefit analyses could help alleviate the problem. Moving forward the Committee will likely hold a hearing in early 2016 on the next WRDA bill. That pace, while welcomed by many, does face practical obstacles considering the Corps has only implemented about 50% of guidance required under the 2014 law. It’s important that the Corps continue to issue guidance and that Congress provides the agency necessary resources in both the operational and construction budgets. No word yet on a Senate timeline.Infrastructure in the News: A Major Bill Goes to Conference
November 6th, 2015 | By: Olivia Wolfertz
With the Surface Transportation Reauthorization & Reform Act of 2015 moving to conference committee and elections on Tuesday, news headlines have been buzzing with wishes and concerns for our nation’s infrastructure. The House has officially approved the Surface Transportation Reauthorization & Reform Act, a six-year bipartisan bill that will provide flat-level funding. The bill must now be reconciled with the Senate’s DRIVE Act in a conference committee working toward a deadline of Nov. 20—when the current short-term extension expires. This decision has sparked many concerns that the bill only continues with the status quo rather than increasing investment to improve our infrastructure. While there are many economic reasons for investing in infrastructure, the safety reasons are equally critical. The New York Times noted that much of our infrastructure—from dams to roads—is operating beyond its intended design life and that modernization will allow for newer design standards, while also enhancing safety. Infrastructure safety concerns are not limited to roads, but expand to bridges, dams and railroads. The House of Representatives has adopted an amendment directing the U.S. DOT to develop a full strategy to address “structurally deficient” and “functionally obsolete” bridges within the next year. A multi-year surface transportation bill is an important step in addressing our nation’s infrastructure needs. With that being said, flat funding won’t be enough to adequately modernize our infrastructure.New York Infrastructure Receives C- Report Card
September 29th, 2015 | By: America's Infrastructure Report Card
- The three airports servicing New York City account for a majority of the nation’s airport delays. By the year 2030, JFK is expected to exceed its current traveler capacity by 30%, and ten other commercial service airports in New York will also exceed 60% of the current capacities.
- Of New York’s more than 17,000 bridges, the majority were built in the 20th century, with over 50% of bridges over 75 years old. Nationally, the average age of a bridge is 42 years.
- The average New York City area commuter, which accounts for half the state’s population, wastes 53 hours per year sitting in traffic.
- Poor road conditions and traffic congestion cost motorists a total of $6.3 billion statewide—an average of $477 per Syracuse motorists.
- The State of New York is only spending 20% of what is needed to modernize the wastewater system.
- One in every four of New York’s wastewater facilities are operating beyond their 30-year useful life expectancy.

- Create a prioritization program to assess the state’s transportation infrastructure needs starting from existing bridge asset management programs and based on accepted standards.
- Develop more consistent funding sources of funding for dams and support the creation of dam rehabilitation funding legislation at the federal and state levels for public and private owners of high hazard and intermediate hazard dams.
- As infrastructure is being rebuilt, make it more resilient and sustainable.
View the full report here.
Founded in 1852, the American Society of Civil Engineers represents more than 145,000 civil engineers worldwide and is America’s oldest national engineering society. ASCE’s 2013 Report Card for America’s Infrastructure, graded America’s cumulative GPA for infrastructure at a D+. The Report Card app for Apple and Android devices includes videos, interactive maps and info-graphics that tell the story behind the grades, as well as key facts for all 50 states.ASCE Provides Expertise at Rockefeller Foundation Resilience Academies
August 4th, 2015 | By: Whitford Remer
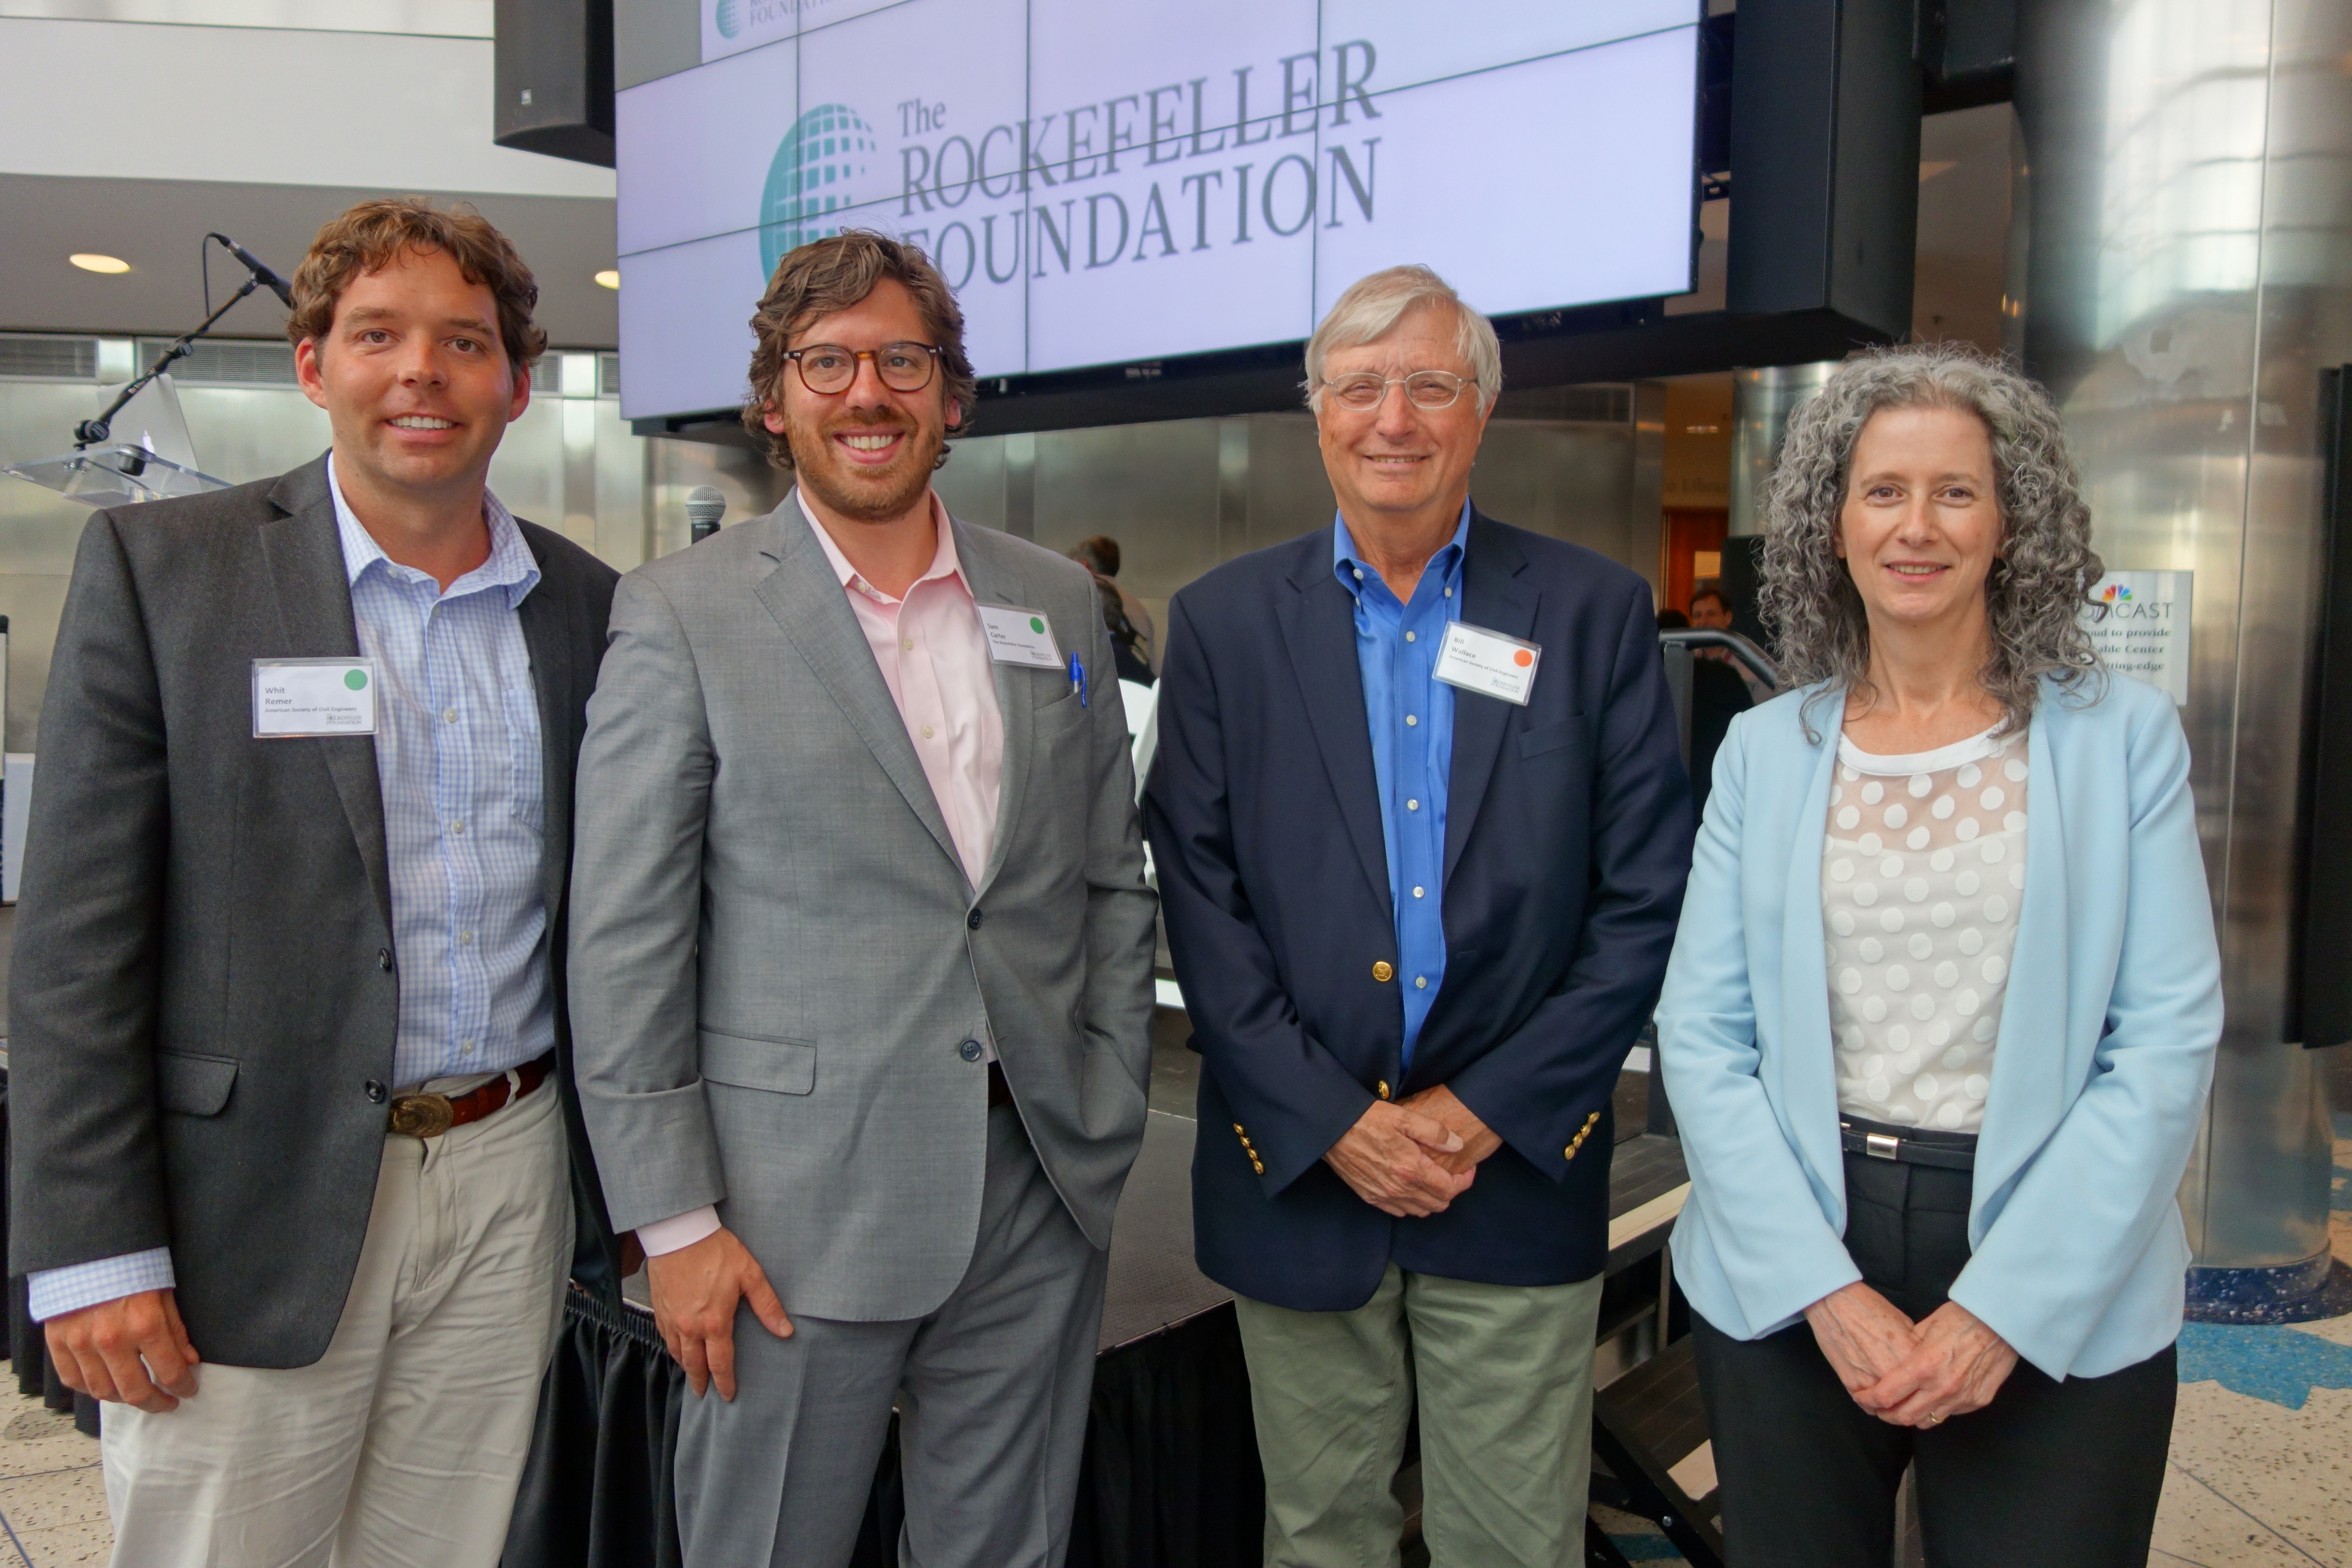
Whit Remer, ASCE Government Relations staff, Sam Carter, Rockefeller Foundation, Bill Wallace, ASCE Member, Jessie Handforth Kome, HUD
WRRDA One Year Later
June 18th, 2015 | By: Whitford Remer
Just over a year ago President Obama signed the Water Resources Reform and Development Act of 2014 (WRRDA) into law. It was the first major water resources bill Congress passed in nearly seven years. Historically, major water resources bills were signed on a two year cycle, but partisanship and a ban on congressional earmarks made the legislation increasingly difficult to pass. Below are some of the major provisions of the law and how far along they have come in the last year. Levee and Dam Safety Programs WRRDA reauthorized the National Dam Safety Program and establishes a Levee Safety Initiative. The Dam Safety Program was last authorized in 2006 and the levee program expands an existing program beyond federally owned levees. WRRDA authorizes $13.9 million annually for the dam program which provides grants to states for activities such as inspections, training programs and public safety awareness campaigns. The levee program is authorized at $79 million annually and charges FEMA and the Army Corps to inventory the estimated 10,000 miles of levees across the country and develop consistent guidelines for designing, building, operating and maintaining the vital flood control structures. For both programs, we recommend full congressional appropriation. While new appropriations are negotiated, the Corps and FEMA should rely on WRRDA authorization and existing funds to set these up. Water Infrastructure Finance Innovative Authority WRRDA establishes a new lending program called the Water Infrastructure Finance and Innovation Act (WIFIA) at the Environmental Protection Agency (EPA) and Army Corps of Engineers for major water resources projects. The program works cooperatively with the Department of Treasury and is modeled off the popular transportation lending program TIFIA. EPA has so far embraced the program and has held a series of informational webinars on its progress and is reportedly hiring staff to oversee the program. The 2015 omnibus appropriations bill gave EPA $2.2 million in administrative costs to get the program up and running and the recently released FY16 draft House EPA appropriations bill provides $4.2 million over two years. The Army Corps has yet to provide any public information on their efforts to start the program and recent Corps appropriations bills make no mention of the program. One thing we’re keeping an eye out on are efforts to remove the prohibition on using tax-exempt bonds to fund the 51% of project cost not eligible for funding through WIFIA. Harbor Maintenance Trust Fund and Inland Waterway Trust Fund Arguably two programs to make the most headway following the passage of WRRDA are the Harbor Maintenance Trust Fund (HMTF) and Inland Water Way Trust Fund (IWTF). WRRDA provided important fixes to these two programs desperately needed to meet demands placed on our on waterway transportation systems. First, WRRDA set new target appropriations for the HMFT, which both the House and Senate hit in their FY16 funding bills. Previously Congress only appropriated a fraction of the funds collected back into related O&M activities. On the inland side, the biggest progress made since WRRDA was actually a result of a late 2014 December bill that extended numerous tax benefits set to expire at the end of the year. Stuffed in that bill was a 9-cent increase to the barge diesel fuel user fee which funds the IWTF. The increase was widely supported by the inland waterway community. Clean Water State Revolving Fund WRRDA made several changes to the Clean Water State Revolving Fund (CWSRF). The new CWSRF provisions provide loan flexibility, lower interest rates and extended repayment periods of 30 years. CWSRF funds may also now be used to implement watershed plans, water conservation, stormwater recapture, and for technical assistance to small and medium treatment works. Reports from the field show the expansion of eligible activities are being utilized. ASCE and other stakeholders also advocated for Qualifications Based Selection (QBS) requirements in the update, which were ultimately adopted in EPA’s implementation guidance to its regional offices. Army Corps of Engineers Project Prioritization Identifying water resources projects ripe for federal investment in the era of earmark bans has proved to be a headache for Congress and the Army Corps of Engineers. To comply with the self-imposed ban, WRRDA Sec. 7001 requires the Corps produce an annual project list for Congress which outlines potential new authorizations. Because the list originates with the Administration rather than with Congress, the process complies with the earmark ban. The Corps released its first report in February, which was front and center at a House Transportation and Infrastructure committee hearing last week. According to testimony by Rep. Gibbs, Congress envisioned a process where nonfederal sponsors would recommend projects to the Corps, which would be included in the list so long as the federal government had some jurisdiction over the project. The issue is only 19 of the 114 projects identified by nonfederal sponsors were included in the report—the rest were relegated to an appendix and according to some congressional lawyers are therefore not eligible for funding. It’s likely Congress will provide cleared instructions on 7001 in the next WRRDA; in the meantime all eyes are on the Army Corps and White House Office of Management and Budget, which also has oversight over the list. Conclusion As described above, a lot has been done in the last year since WRRDA was signed. While this may help tick up the ASCE Report Card for Americas Infrastructure Cumulative Grade of D+, much work lay ahead. There is still a $60 billion backlog of projects at the Army Corps and skepticism remains that WRRDA’s public private partnership can help reduce that backlog. President Obama’s proposal for new public infrastructure financing still needs support in Congress. We hope Congress will stick to its goal of passing a WRRDA every two years. In the meantime, they should appropriate funds for the programs that were authorized in the last WRRDA 2014.Dam Safety Deserves Awareness
May 29th, 2015 | By: Whitford Remer
 Extreme storms in Texas and Oklahoma are testing the strength of many dams this week. Our thoughts are with those affected, and it is hoped that there are no dam failures contributing to the challenges these communities face. Such failures have had dire effects; it was this same week back in 1889 when the worst dam failure in U.S. history occurred – known as the Johnstown (Penn.) Flood – when the South Fork Dam failed killing more than 2,200 people. On Sunday – May 31st –we commemorate this day as National Dam Safety Awareness Day to remind ourselves of the lessons learned after that failure.
As we approach National Dam Safety Awareness Day, it’s important to take a minute to underscore the state of dam infrastructure across the nation, given a “D” grade in the Infrastructure Report Card.
Dams are an extremely important part of this nation’s infrastructure—equal in importance to bridges, roads, airports, and other major components of the infrastructure. They can serve several functions at once, including water supply for domestic, agricultural, industrial, and community use; flood control; recreation; and clean, renewable energy through hydropower. However, dams also pose a tremendous potential hazard to downstream residents and infrastructure, so dam owners and regulators must observe proper safety methods to maintain these important functions and minimize downstream risk.
Could the South Fork Dam failure happen today? Advances in dam safety engineering practices and regulation coupled with emergency action planning make living near a dam safer. Historically, dams that failed had some deficiency, which caused the failure. These dams are typically termed deficient. Currently, there are about 4,400 deficient dams in the U.S. There are dams with this classification in nearly every state. (A majority of states and federal agencies define a deficient dam as one that has been found to have hydraulic or structural deficiencies that leave it more susceptible to failure.) Lagging behind is the number of deficient dams that have been repaired. The Association of State Dam Safety Officials (ASDSO) has determined that it could cost up to $18 billion to rehabilitate the back-log of non-federal (those subject to state regulation) high-hazard potential dams that need repair. High–hazard potential dams, should they fail, would most likely cause loss of life and significant economic losses.
To help address these investment needs, the Water Resources Reform and Development Act of 2014 reauthorized the National Dam Safety Program. While ASCE and ASDSO have made advances to promote dam safety programs, increase awareness, provide training, and fund rehabilitation initiatives, there are still significant financial shortfalls. Tell congressional appropriators to fully fund the WRRDA authorized programs. It should not take another Johnstown or a dam failure in Texas and Oklahoma to raise awareness to fund these essential safety programs.
This post is co-authored by Lori Spragens, executive director of ASDSO.
Extreme storms in Texas and Oklahoma are testing the strength of many dams this week. Our thoughts are with those affected, and it is hoped that there are no dam failures contributing to the challenges these communities face. Such failures have had dire effects; it was this same week back in 1889 when the worst dam failure in U.S. history occurred – known as the Johnstown (Penn.) Flood – when the South Fork Dam failed killing more than 2,200 people. On Sunday – May 31st –we commemorate this day as National Dam Safety Awareness Day to remind ourselves of the lessons learned after that failure.
As we approach National Dam Safety Awareness Day, it’s important to take a minute to underscore the state of dam infrastructure across the nation, given a “D” grade in the Infrastructure Report Card.
Dams are an extremely important part of this nation’s infrastructure—equal in importance to bridges, roads, airports, and other major components of the infrastructure. They can serve several functions at once, including water supply for domestic, agricultural, industrial, and community use; flood control; recreation; and clean, renewable energy through hydropower. However, dams also pose a tremendous potential hazard to downstream residents and infrastructure, so dam owners and regulators must observe proper safety methods to maintain these important functions and minimize downstream risk.
Could the South Fork Dam failure happen today? Advances in dam safety engineering practices and regulation coupled with emergency action planning make living near a dam safer. Historically, dams that failed had some deficiency, which caused the failure. These dams are typically termed deficient. Currently, there are about 4,400 deficient dams in the U.S. There are dams with this classification in nearly every state. (A majority of states and federal agencies define a deficient dam as one that has been found to have hydraulic or structural deficiencies that leave it more susceptible to failure.) Lagging behind is the number of deficient dams that have been repaired. The Association of State Dam Safety Officials (ASDSO) has determined that it could cost up to $18 billion to rehabilitate the back-log of non-federal (those subject to state regulation) high-hazard potential dams that need repair. High–hazard potential dams, should they fail, would most likely cause loss of life and significant economic losses.
To help address these investment needs, the Water Resources Reform and Development Act of 2014 reauthorized the National Dam Safety Program. While ASCE and ASDSO have made advances to promote dam safety programs, increase awareness, provide training, and fund rehabilitation initiatives, there are still significant financial shortfalls. Tell congressional appropriators to fully fund the WRRDA authorized programs. It should not take another Johnstown or a dam failure in Texas and Oklahoma to raise awareness to fund these essential safety programs.
This post is co-authored by Lori Spragens, executive director of ASDSO.
Tags: Dam Safety, dams
Comments Closed
What You Don't Know About Vermont's Dams
April 20th, 2015 | By: Infrastructure Report Card
What you probably don’t know about Vermont’s dams is that no one knows exactly what the condition of these structures is. Just as much as poor condition, it’s the lack of information that poses a risk to Vermont. This is the lesson Jessica Louisos, a civil engineer with the Waterbury firm Milone & MacBroom and a co-author of the Report Card for Vermont’s Infrastructure by the American Society of Civil Engineers, shares in a new PBS interview.Tags: dams, legislation, report card, Vermont
No Comments »
Virginia's Infrastructure Struggle for Status Quo
January 23rd, 2015 | By: Infrastructure Report Card
With a state that’s growing as fast as Virginia, you’re bound to have growing pains, but none are as striking or obvious as the traffic gridlock across the state. So, would you be surprised that the Virginia Section of the American Society of Civil Engineers gave roads a D grade in their new 2015 Report Card for Virginia’s Infrastructure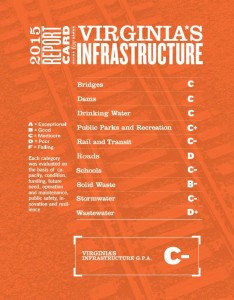 ? While some big steps were taken by the legislature in 2013 to bring renewed funding to transportation, may end up only keeping the status quo of transportation troubles across the state whether by car or transit. Another growing pain issue for Virginia is there are a lot of dams in the state (1,789 to be exact) and the number of people that now live behind old dams has increased with the growth of the state. The majority of dams were constructed between 1950 and 1975, making the average age more than 50 years old. With an increasing population, more houses and businesses are now below dams which means there’s more risk for damage and lives being lost if there was a failure. The good news is that Virginia has made a lot of progress in identifying and educating owners on how to fix dams that are considered high-hazard, but the bad news is that 141 of these high-hazard dams do not meet current dam safety standards, resulting in a grade of C for Virginia’s dams. Growth is also affecting schools as localities try to keep up with growing schools in some areas and older school maintenance in localities that seem to be losing students and residents.
Not only is Virginia growing, but its infrastructure is also starting to show its age with basic services like water, wastewater, and stormwater representing the old infrastructure bones of the cities. Virginia’s 2,830 public water systems providing drinking water to more than 7 million Virginians, and the Report Card found that many of these systems are 70 years or older and require significant asset renewal in the immediate future. The bad news is that funding is slim – from 2000 to 2012, the state only saw $200 million in Drinking Water State Revolving Funds, which is less than 10% of the commonwealth’s total investment needs. Wastewater needs have jumped 45%, and best estimates show $1 billion is needed to control overflows that pollute local waters. Also, stormwater systems are equally old, and surveys show about one-third of the infrastructure is older than 50 years and much of the remainder was built 25 to 50 years ago. While every bit of funding helps, the reality is Virginia’s water systems are only getting older each day and each dollar available is being split between trying to fix yesterday’s problems and today’s.
Growth and age are like a one-two punch to Virginia’s infrastructure causing a real struggle to maintain an acceptable level of infrastructure service for the state. Virginia’s C- infrastructure shows the Commonwealth is barely maintaining the status quo, and without significant change, it will be a struggle to maintain even the current gridlock of roads and frequent water pipe breaks without new solutions. In the Report Card, they give 3 solutions to raise Virginia’s grades:
1. Increase Leadership in Infrastructure Renewal: Virginia’s infrastructure is the responsibility of all our leaders. We need bold leadership and a vision for how strategic infrastructure investment can improve the current status quo.
2. Promote Sustainability and Resilience: Today’s infrastructure must meet the state’s needs in the best and worst of times, and also protect and improve the environment and our quality of life.
3. Develop Comprehensive Strategies: Virginia should prioritize and execute infrastructure strategies that put our investments where they are needed most, according to well-conceived plans that focus on comprehensive solutions that provide a good return on investment.
The Virginia legislature is just getting started, and there is no better time for them to take a second look at the infrastructure they are responsible for than now with a fresh update from the civil engineers who work on the state’s infrastructure every day.
? While some big steps were taken by the legislature in 2013 to bring renewed funding to transportation, may end up only keeping the status quo of transportation troubles across the state whether by car or transit. Another growing pain issue for Virginia is there are a lot of dams in the state (1,789 to be exact) and the number of people that now live behind old dams has increased with the growth of the state. The majority of dams were constructed between 1950 and 1975, making the average age more than 50 years old. With an increasing population, more houses and businesses are now below dams which means there’s more risk for damage and lives being lost if there was a failure. The good news is that Virginia has made a lot of progress in identifying and educating owners on how to fix dams that are considered high-hazard, but the bad news is that 141 of these high-hazard dams do not meet current dam safety standards, resulting in a grade of C for Virginia’s dams. Growth is also affecting schools as localities try to keep up with growing schools in some areas and older school maintenance in localities that seem to be losing students and residents.
Not only is Virginia growing, but its infrastructure is also starting to show its age with basic services like water, wastewater, and stormwater representing the old infrastructure bones of the cities. Virginia’s 2,830 public water systems providing drinking water to more than 7 million Virginians, and the Report Card found that many of these systems are 70 years or older and require significant asset renewal in the immediate future. The bad news is that funding is slim – from 2000 to 2012, the state only saw $200 million in Drinking Water State Revolving Funds, which is less than 10% of the commonwealth’s total investment needs. Wastewater needs have jumped 45%, and best estimates show $1 billion is needed to control overflows that pollute local waters. Also, stormwater systems are equally old, and surveys show about one-third of the infrastructure is older than 50 years and much of the remainder was built 25 to 50 years ago. While every bit of funding helps, the reality is Virginia’s water systems are only getting older each day and each dollar available is being split between trying to fix yesterday’s problems and today’s.
Growth and age are like a one-two punch to Virginia’s infrastructure causing a real struggle to maintain an acceptable level of infrastructure service for the state. Virginia’s C- infrastructure shows the Commonwealth is barely maintaining the status quo, and without significant change, it will be a struggle to maintain even the current gridlock of roads and frequent water pipe breaks without new solutions. In the Report Card, they give 3 solutions to raise Virginia’s grades:
1. Increase Leadership in Infrastructure Renewal: Virginia’s infrastructure is the responsibility of all our leaders. We need bold leadership and a vision for how strategic infrastructure investment can improve the current status quo.
2. Promote Sustainability and Resilience: Today’s infrastructure must meet the state’s needs in the best and worst of times, and also protect and improve the environment and our quality of life.
3. Develop Comprehensive Strategies: Virginia should prioritize and execute infrastructure strategies that put our investments where they are needed most, according to well-conceived plans that focus on comprehensive solutions that provide a good return on investment.
The Virginia legislature is just getting started, and there is no better time for them to take a second look at the infrastructure they are responsible for than now with a fresh update from the civil engineers who work on the state’s infrastructure every day.
Tags: dams, infrastructure, resilience, schools, stormwater, sustainability, Virginia, wastewater, water
No Comments »
Dams in 26 States Are Getting Some TLC
December 30th, 2014 | By: Infrastructure Report Card
While the average person might think it’s just about farms, the Farm Bill funding for dams was perhaps one of the most unsung wins for infrastructure in 2014. The 2014 Farm Bill that Congress passed in the summer provided USDA with $262 million to distribute to states for rehabilitating dams. The funding provided rehabilitation assistance for 150 dams in 26 states. This increased the typical annual investment in rehabilitation 20 times over! Dam infrastructure’s role in flood management, water supply, and agricultural productivity is critical to the economy. Here’s a quick breakdown of the Watershed Rehabilitation assistance by state:| Project Name | Assistance Provided |
| Arizona | $98,137,300 |
| Texas | $33,842,975 |
| Oklahoma | $26,420,000 |
| West Virginia | $14,200,099 |
| Utah | $12,655,000 |
| Pennsylvania | $11,380,500 |
| Massachusetts | $8,976,000 |
| Nebraska | $7,515,236 |
| Virginia | $7,285,000 |
| Mississippi | $5,675,000 |
| Colorado | $2,940,000 |
| New York | $2,900,000 |
| Tennessee | $2,300,000 |
| Kansas | $1,751,000 |
| Oregon | $1,374,000 |
| Kentucky | $1,163,000 |
| Ohio | $708,000 |
| New Mexico | $600,000 |
| Wyoming | $543,103 |
| Connecticut | $450,000 |
| Arkansas | $445,500 |
| North Dakota | $294,000 |
| Nevada | $280,000 |
| Idaho | $249,000 |
| Georgia | $225,000 |
| New Hampshire | $50,000 |
Tags: congress, dams, Farm Bill, safety, states
No Comments »