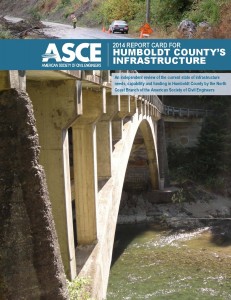
The North Coast Branch of the American Society of Civil Engineers released a new 2016 Report Card for Humboldt County's Water Infrastructure to show the state of the water infrastructure across Humboldt County. The report found that today's water infrastructure earned a good B grade overall, but to keep a good grade, planning must begin today for the infrastructure that is aging and will need replacement over the next 10 years. They released the Report Card at the Humboldt Bay Municipal Water facility with representatives from the Municipal Water District, McKinleyville Community Services District Board of Directors, Bear River Band of the Rohnerville Rancheria, and the Loleta Community Services District. This effort follows the release of the Report Card for Humboldt County's Transportation Infrastructure in 2014 which reviewed the area’s transportation needs. Together, these reports provide citizens a clear look at today's challenges and tomorrow's needs.
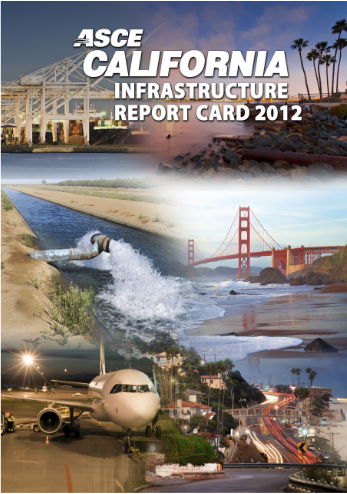 The magnificent Golden Gate and San Diego–Coronado bridges; the Hoover, the Grand Coulee and other great dams and water systems of the west; our transcontinental railroads and unparalleled network of modern interstates; the airports, seaports, tunnels and transit systems that serve our cities—all of these are part of the California infrastructure.
Over the next 20 years, California is expected to grow at a rapid pace. Based on some estimates the state will add an additional 10 million residents over the next 20 years,putting California’s population at a staggering 48 million people. A well-designed and maintained infrastructure anchors our economy and secures our quality of life.
Investment in infrastructure is vital to our state’s productivity, competitiveness and economic well-being.Congestion on our highways alone costs the United States an estimated $100 billion a year.Communities with efficient road systems, good schools and sewers can better attract residents and businesses. With updated water treatment plants, we can trust our tap water is safe. When traffic flows, goods and services move to market faster and more efficiently, lowering the cost to consumers. Modern school buildings provide a secure and healthy environment where our children can concentrate on learning. Efficient waste management programs reduce waste volume, and dispose of and contain waste effectively.
Read the full Report Card for California's Infrastructure here.
 Aviation
 Drinking Water
 Levees
 Solid Waste
 Urban Runoff
 Wastewater
A: Exceptional, B: Good, C: Mediocre, D: Poor, F: Failing, ?: Incomplete
Each category was evaluated on the basis of capacity, condition, funding, future need, operation and maintenance, public safety, resilience, and innovation
Aviation
191 public-use airports
Bridges
2,769 of the 24,955 bridges are structurally deficient
Bridges
$429.30 million in bridge funds came from the Federal Highway Bridge Fund in 2011
Dams
52% of the state regulated dams have an Emergency Action Plan
Dams
678 high hazard dams
Drinking Water
$44.5 billion in drinking water infrastructure needs over the next 20 years
Energy
58.881 gigawatt-hours of renewable energy every year, ranking it 2nd
Hazardous Waste
98 sites on the National Priorities List
Inland Waterways
290 miles of inland waterways, ranking it 26th nationally
Levees
13,571 miles of levees
Ports
220.8 million short tons of cargo in 2012, ranking it 3rd nationally
Public Parks
$3.6 billion of unmet needs for its parks system
Rail
25 freight railroads covering 5,307 miles across the state, ranking 3rd nationally by mileage
Roads
$17 billion a year in costs to motorists from driving on roads in need of repair, which is $703 /yr per motorist
Roads
31,827 of the state’s 175,499 public roads are major roads, and 34% are in poor condition
Schools
$25.4 billion in estimated school infrastructure funding needs
Transit
1.4 billion annual unlinked passenger trips via transit systems including bus, transit, and commuter trains
Wastewater
$29.9 billion in wastewater infrastructure needs over the next 20 years

March 03, 2017
As the President’s repeated in his address to Congress his pledge to dramatically increase infrastructure spending to the tune of $1 trillion, various Congressional Committees
March 01, 2017
On Tuesday night, President Trump addressed a joint-session of Congress for the first time in his presidency. Infrastructure was among the many issues he discussed.
February 28, 2017
U.S. motorists set a new record for vehicle miles travelled (VMT) in 2016, driving over 3.2 trillion miles, an increase of 70 billion miles from

February 17, 2017
Romantic dates, the Grammy awards and celebrating black history are not the only milestones of this week; the Oroville dam crisis in California and the